Straight to your inbox
Get the best email and digital marketing content delivered.
Join 250,000 in-the-know marketers and get the latest marketing tips, tactics, and news right in your inbox.
SubscribeWe analysed millions of email marketing campaigns sent in Australia. This is what we found.
2020 was a turbulent year for marketers around the world, and Australia was no exception. An analysis of billions of emails sent by Australian organisations in 2020 shows new, interesting trends emerging that could have lasting implications for the future success of your strategies.
These campaigns were sent to subscribers around the world from Australian organisations using CM Group brands. We’ve compiled all that data into a single, comprehensive resource so any Aussie email marketer or business leader can study industry averages and measure how their email marketing strategy compares.
We’ve broken down these averages by industry as well as by day so you can dive as deep as you like into the numbers. They’ll serve as a useful point of reference to help you determine whether your approach to email is cutting edge, or has some work to do. This means you can do more of what works, adjust what is underperforming, and ultimately, find the perfect email marketing plan that encourages engagement and maximises revenue.
This year was defined by rapid change that necessitated flexibility and adaptation. At a time of uncertainty, Australian brands and consumers alike turned heavily to one of the most reliable and familiar channels available to maintain connection: email.
Our benchmarks suggest that we’re not only seeing changes occur in individual industries, but we also see variation in our Australian email benchmark averages. Examining the email data closely, a few remarkable things stand out.
Overall, campaigns sent by Australia-based organisations in 2020 outperformed their counterparts around the world in most key performance indicators. Open rate, click-through rate, and click-to-open rates were all significantly higher than the global average.
The unsubscribe benchmark for Australian brands is .2%, about double the global average unsubscribe rate. This is the only core metric where Australian marketers lagged behind worldwide performance, and maintains a steady trend from recent years.
Emails were opened and clicked on more frequently than in years past, a trend seen around the world that was heavily influenced by COVID-19. Open rates grew from 18.7% to 20.6%, while click rates increased from 2.8% to 3.1%. While these may look like small shifts, they can translate into a large impact on the bottom line.
When it came to persuading subscribers to open the email, these verticals were consistently above par for Australia. Education earned a whopping 34.3% open rate, followed by Food & Beverages at 33.6% and Government & Politics 31.0%. Of the three, Australian Food & Beverage brands far outstripped the global average, more than doubling the benchmark open rate for their industry of 15.2%!
Education (5.7%), Government & Politics (5.5%), and Media, Entertainment, & Publishing (5.3%) all stand well ahead of the pack in click rates benchmarks; no other verticals broke the 4% mark. This loosely mirrors global industry trends with the exception of the Australian Media, Entertainment, & Publishing sector, which is far ahead of the global average of 3.6%
Click here to explore Ultimate Global Email Marketing Benchmarks for 2021
Here are the average benchmarks for Australian senders at a high level.
Check out the data below to discover how your key metrics perform relative to other Australian companies in your industry.
View the complete 2021 Global Email Marketing Benchmarks report for a more comprehensive analysis of overall email marketing statistics last year.
Explore more resources on open rates here.
Explore more resources on click-through rates here.
Explore more resources on click-to-open rates here.
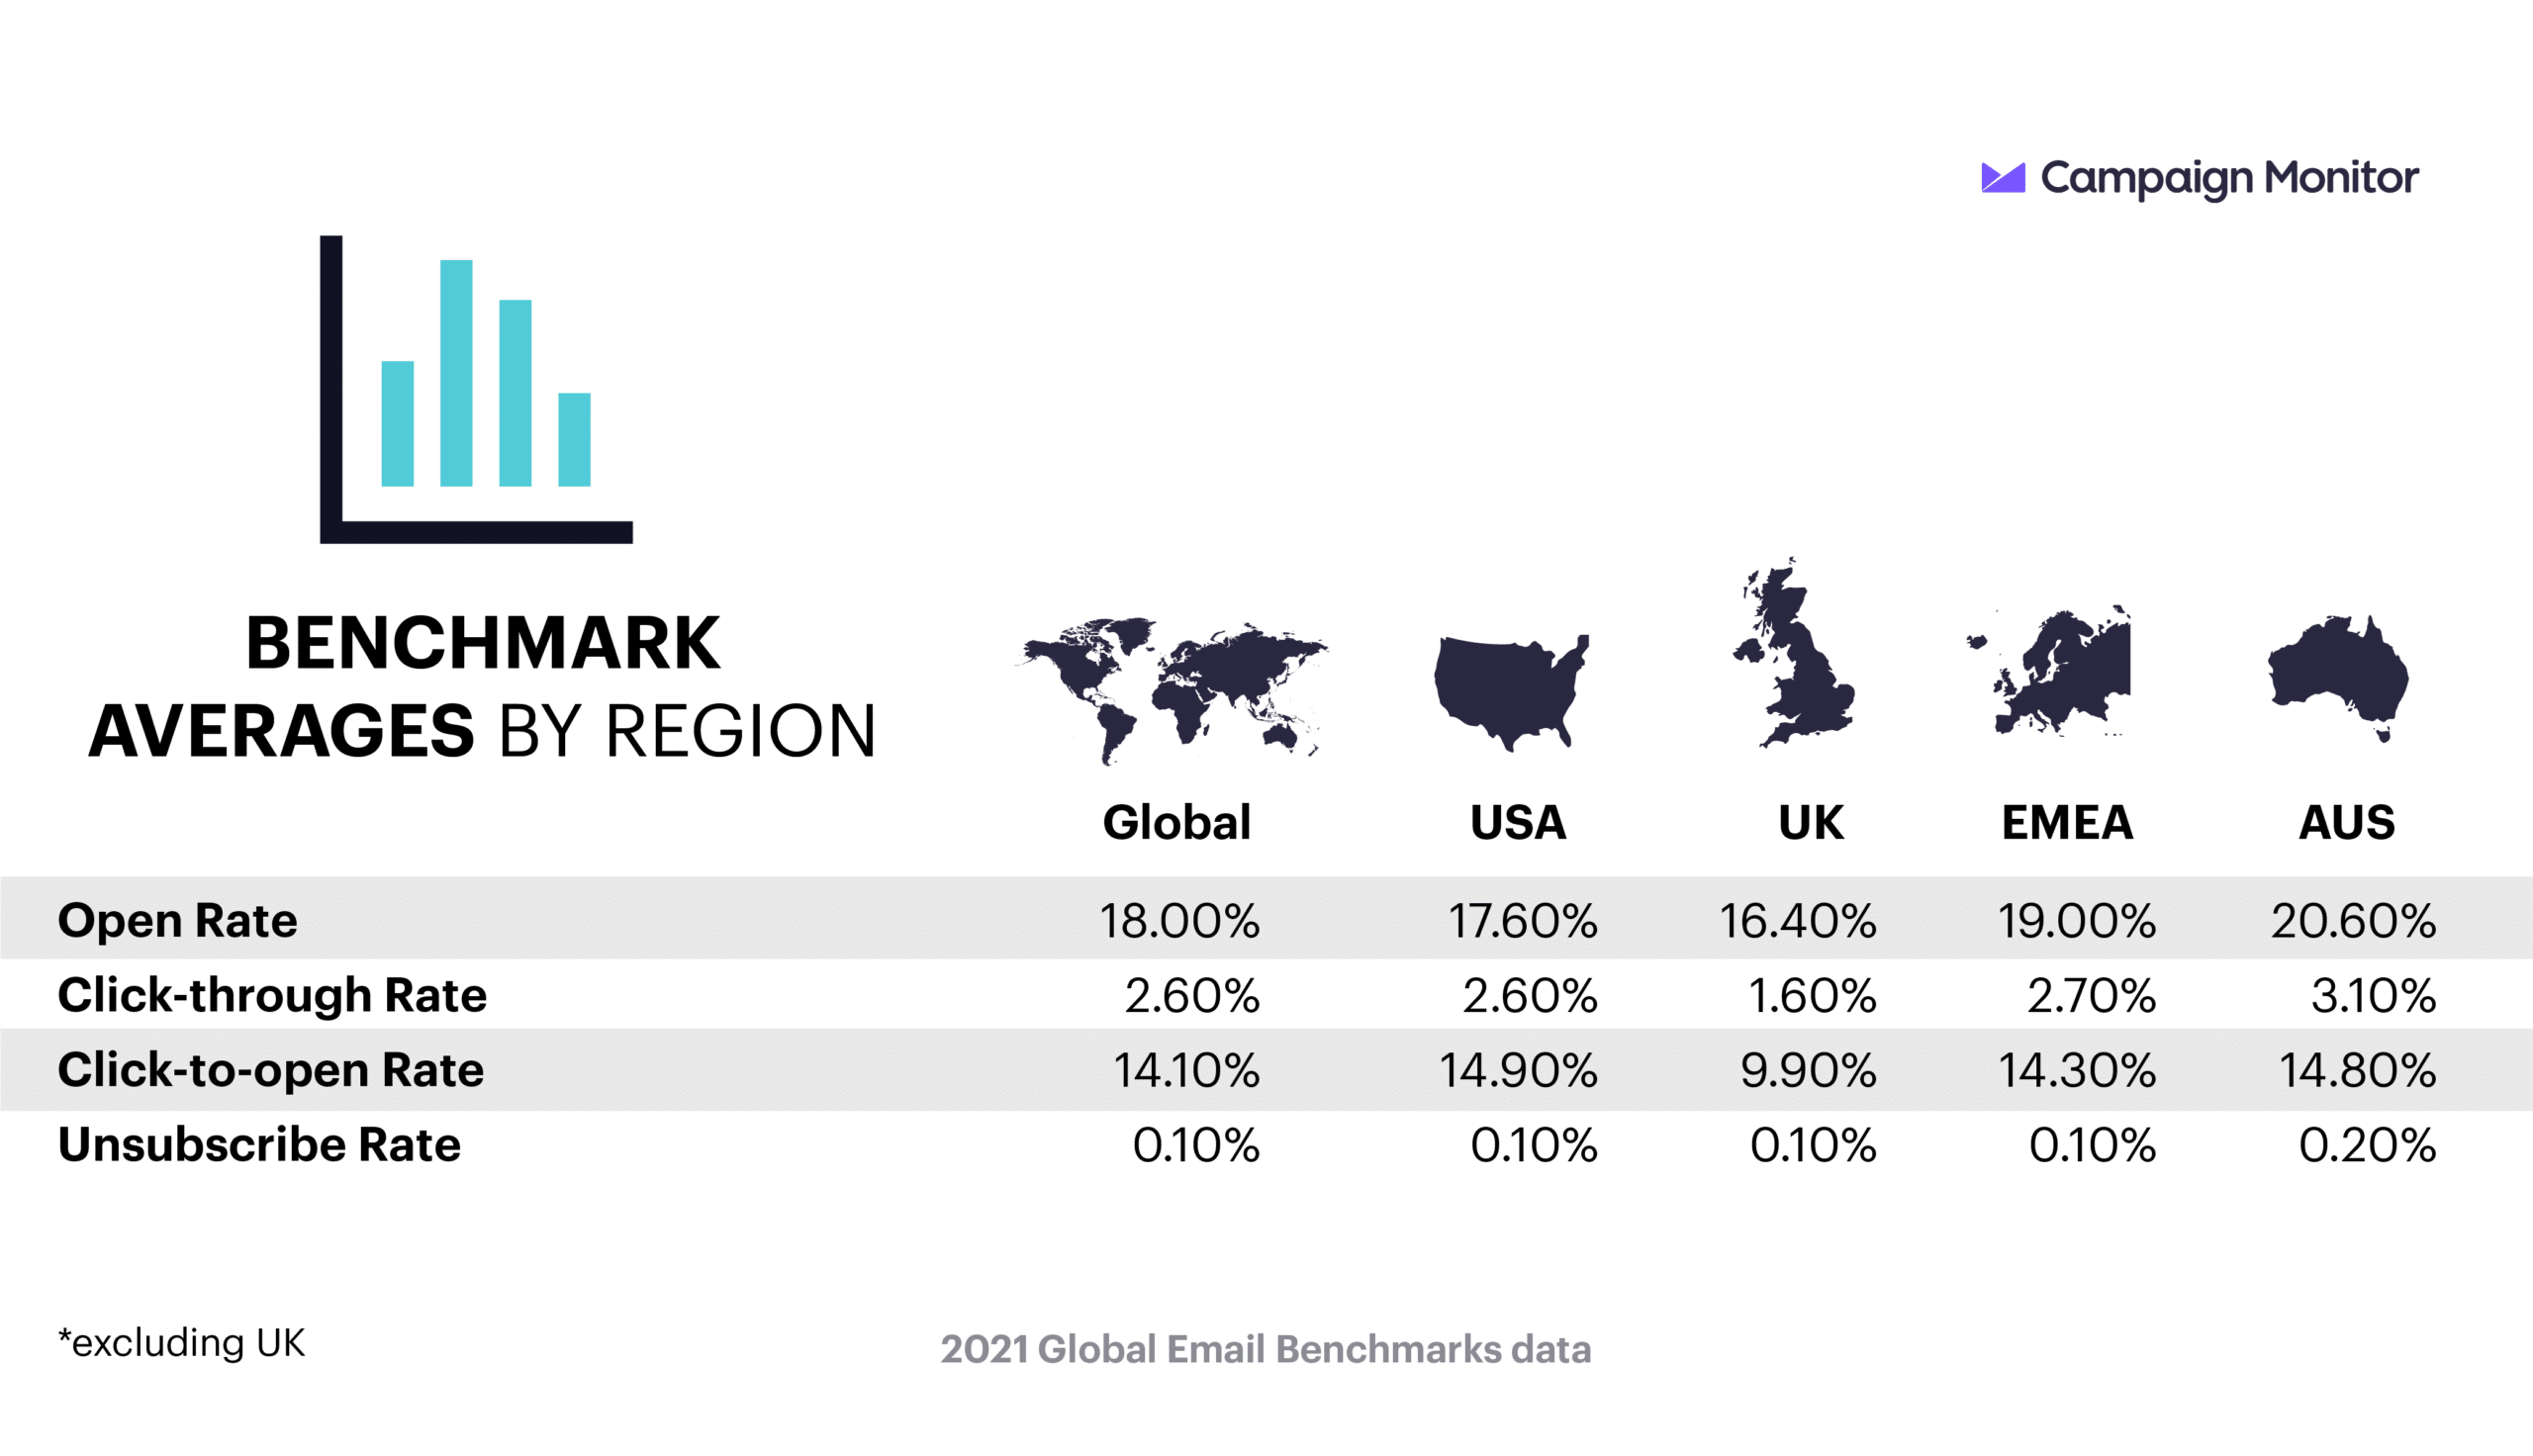
These are the average benchmarks broken down by metric so you can see how Australia compares to other regions.
Email open rate is the percentage of opens out of the total emails that reached an inbox (i.e. excluding bounces).
Open rates can vary from campaign to campaign depending on the content you offer and the subject lines used. We found an average open rate of 18.7%.
How to improve your email open rate:
Explore more resources on open rates >>
The email click-through rate is the number of subscribers who click on a link or image in your email out of the total emails that have been delivered.
Your click-through rate can show you what topics, images, copy, and CTAs lead to the greatest amount of site traffic and engagement, allowing you to deliver more content that resonates with your subscribers. We found a click-through rate of 2.8%.
How to improve your email click-through rate:
Explore more resources on click-through rates >>
Similar to the click-through rate, the email click-to-open rate is the percentage of people who click somewhere in your message out of the total number of opens. It will be a higher percentage than your click-through rate since it measures the people who click out of a smaller population of subscribers (i.e. only those that opened the email).
Your click-to-open rate can measure how immediately effective your email is since you’ll know how many people were inspired directly by that email’s content to visit your site. We found an average email click-to-open rate of 14.9%.
How to improve your email click-to-open rate:
Explore more resources on click-to-open rates >>
An unsubscribe occurs when a subscriber opts out of receiving emails from you. While you want to aim for a small unsubscribe rate, getting your rate down to 0% isn’t realistic. Some list churn is normal and healthy.
Your unsubscribe rate can teach you if certain content, topics, or send cadences result in a spike of unsubscribes. That way you can measure how unhappy or disinterested your audience is. We found an average unsubscribe rate of 0.2%.
How to improve your email unsubscribe rate:
Explore more resources on unsubscribe rates >>
A bounced email is an email that couldn’t be delivered, either because of permanent or temporary issues. For instance, an email will bounce because of delivery failure due to server or spam issues, or possibly because the recipient’s inbox is too full.
The bounce rate is the percentage of subscribers who didn’t receive your message, regardless of whether or not you experienced a hard or soft bounce.
How to improve your email bounce rate:
Explore more resources on bounce rates>>
Your email deliverability will impact everything from your open rate to clicks and conversions because it measures your ability to deliver emails to subscribers’ inboxes.
Poor engagement, being marked as spam, and bounces will negatively affect your deliverability, meaning you land in fewer inboxes and see a smaller return from your email marketing efforts.
How to improve your email deliverability:
While these benchmarks can show you where and how your email marketing can be improved, you can also learn a lot by comparing your email marketing metrics over time.
Are your open rates staying consistent and even improving while you grow your list? Or is an old and stagnant list resulting in low open rates? It’s also important to keep your eye on open rates, spam rates, and your deliverability to ensure you grow your list wisely, rather than just quickly.
These benchmarks can show you the overall health of your email marketing strategy by letting you compare your metrics to your competitors. But you also need to compare your metrics today to your metrics over time to see the overall trends in your program.
Only you know your audience. If you compare your results to these benchmarks, remember that your industry and specific niche means you have a unique audience. Testing your content, offers, and strategy will refine your emails so that every send gets you one step closer to your best results possible.
You’ll notice we discuss “averages.” These averages are created using all campaigns. Some industries send more emails than others, so we calculate averages by all campaigns sent, regardless of industry.
You’ll also see an “Unknown” category in our list of industries. These are Campaign Monitor accounts that don’t fit into a particular industry, or the industry for these accounts isn’t listed.
We also discuss email metrics at length in this guide. To read up on what each metric means and how it’s calculated, visit this post.
We’ve seen that other channels are gaining traction in the marketing space, but email marketing continues to be a powerhouse for revenue. We know professionals are eager to see regional, industry-specific email benchmarks, especially since these numbers project accurate goals.
By reading our benchmarks, we hope email goals become more accessible to you. These benchmarks aim to illustrate how well your numbers compare to industry averages. You can use them to improve the metrics that are lacking, and see where you’ve found success.
This means you can do more of what works, tweak what underperforms, and, ultimately, find that email marketing sweet spot where you see the most engagement and conversions from your subscribers.

Join 250,000 in-the-know marketers and get the latest marketing tips, tactics, and news right in your inbox.
SubscribeWith our powerful yet easy-to-use tools, it's never been easier to make an impact with email marketing.
Try it for free