Straight to your inbox
Get the best email and digital marketing content delivered.
Join 250,000 in-the-know marketers and get the latest marketing tips, tactics, and news right in your inbox.
SubscribeWe analysed billions of emails sent from the UK between January and December 2020 in order to understand email marketing trends over the past year. This data means that marketers can strategize for 2021 with the hard facts they need to put their best foot forward.
Following evidence-based best practices can help your brand achieve metrics far and above your industry averages, regardless of where your performance lands right now.
Unfortunately, email engagement decreased for UK marketers over the course of 2020 for most of the metrics we study. However, this was a year unlike any other and we have to understand the context of the year to truly know how best to move forward for 2021.
This year, marketers sent a lot of emails and we saw open rates—as well as the other engagement metrics—decrease over the course of the year. We refer to this as email fatigue, a phenomenon most marketers are probably familiar with. Whenever a subscriber gets too many emails, they tend to engage progressively less with each send.
If you’re seeing lower engagement rates than usual, there are a couple steps you should take right away. First, make sure you are only sending emails to the segments that will be the most interested in receiving them. It’s tempting to select all when you have a major announcement—whether that’s related to COVID-19 or something else—but not everyone will be interested in hearing every announcement. Choose your segments wisely. Try our segmentation tools.
Secondly, run a re-engagement campaign and make sure you have an up-to-date subscriber list. If someone hasn’t been engaging with your emails for several months, send them an email asking if they would like to continue hearing from you. If they say yes, you’ve re-engaged them. If they say no, then you can get rid of the dead weight and you’ll see better inbox placement and ultimately better engagement.
Retail had a difficult time engaging email subscribers, with such a large amount of emails with low open rates that it brought down the entire average. However, that doesn’t mean email was a failure this past year. Retail emails averaged a 0.0% unsubscribe rate even though subscribers didn’t engage as often as we would like.
While we cannot say exactly why this is—you’d have to ask each of your subscribers why to learn that—we do know that 2020 contained a lot of unknowns. And when the economy struggles, often people react by holding onto their discretionary income.
That means spending less, and it can also mean fewer people reading marketing emails. After all, it’s a lot less fun to see all the great deals and new products retailers offer if you aren’t going to buy any of them.
What matters is that even though subscribers weren’t engaging with retailers’ emails, they still want to stay on their email list. This probably means that when they feel more comfortable, they’ll be opening and clicking once again.
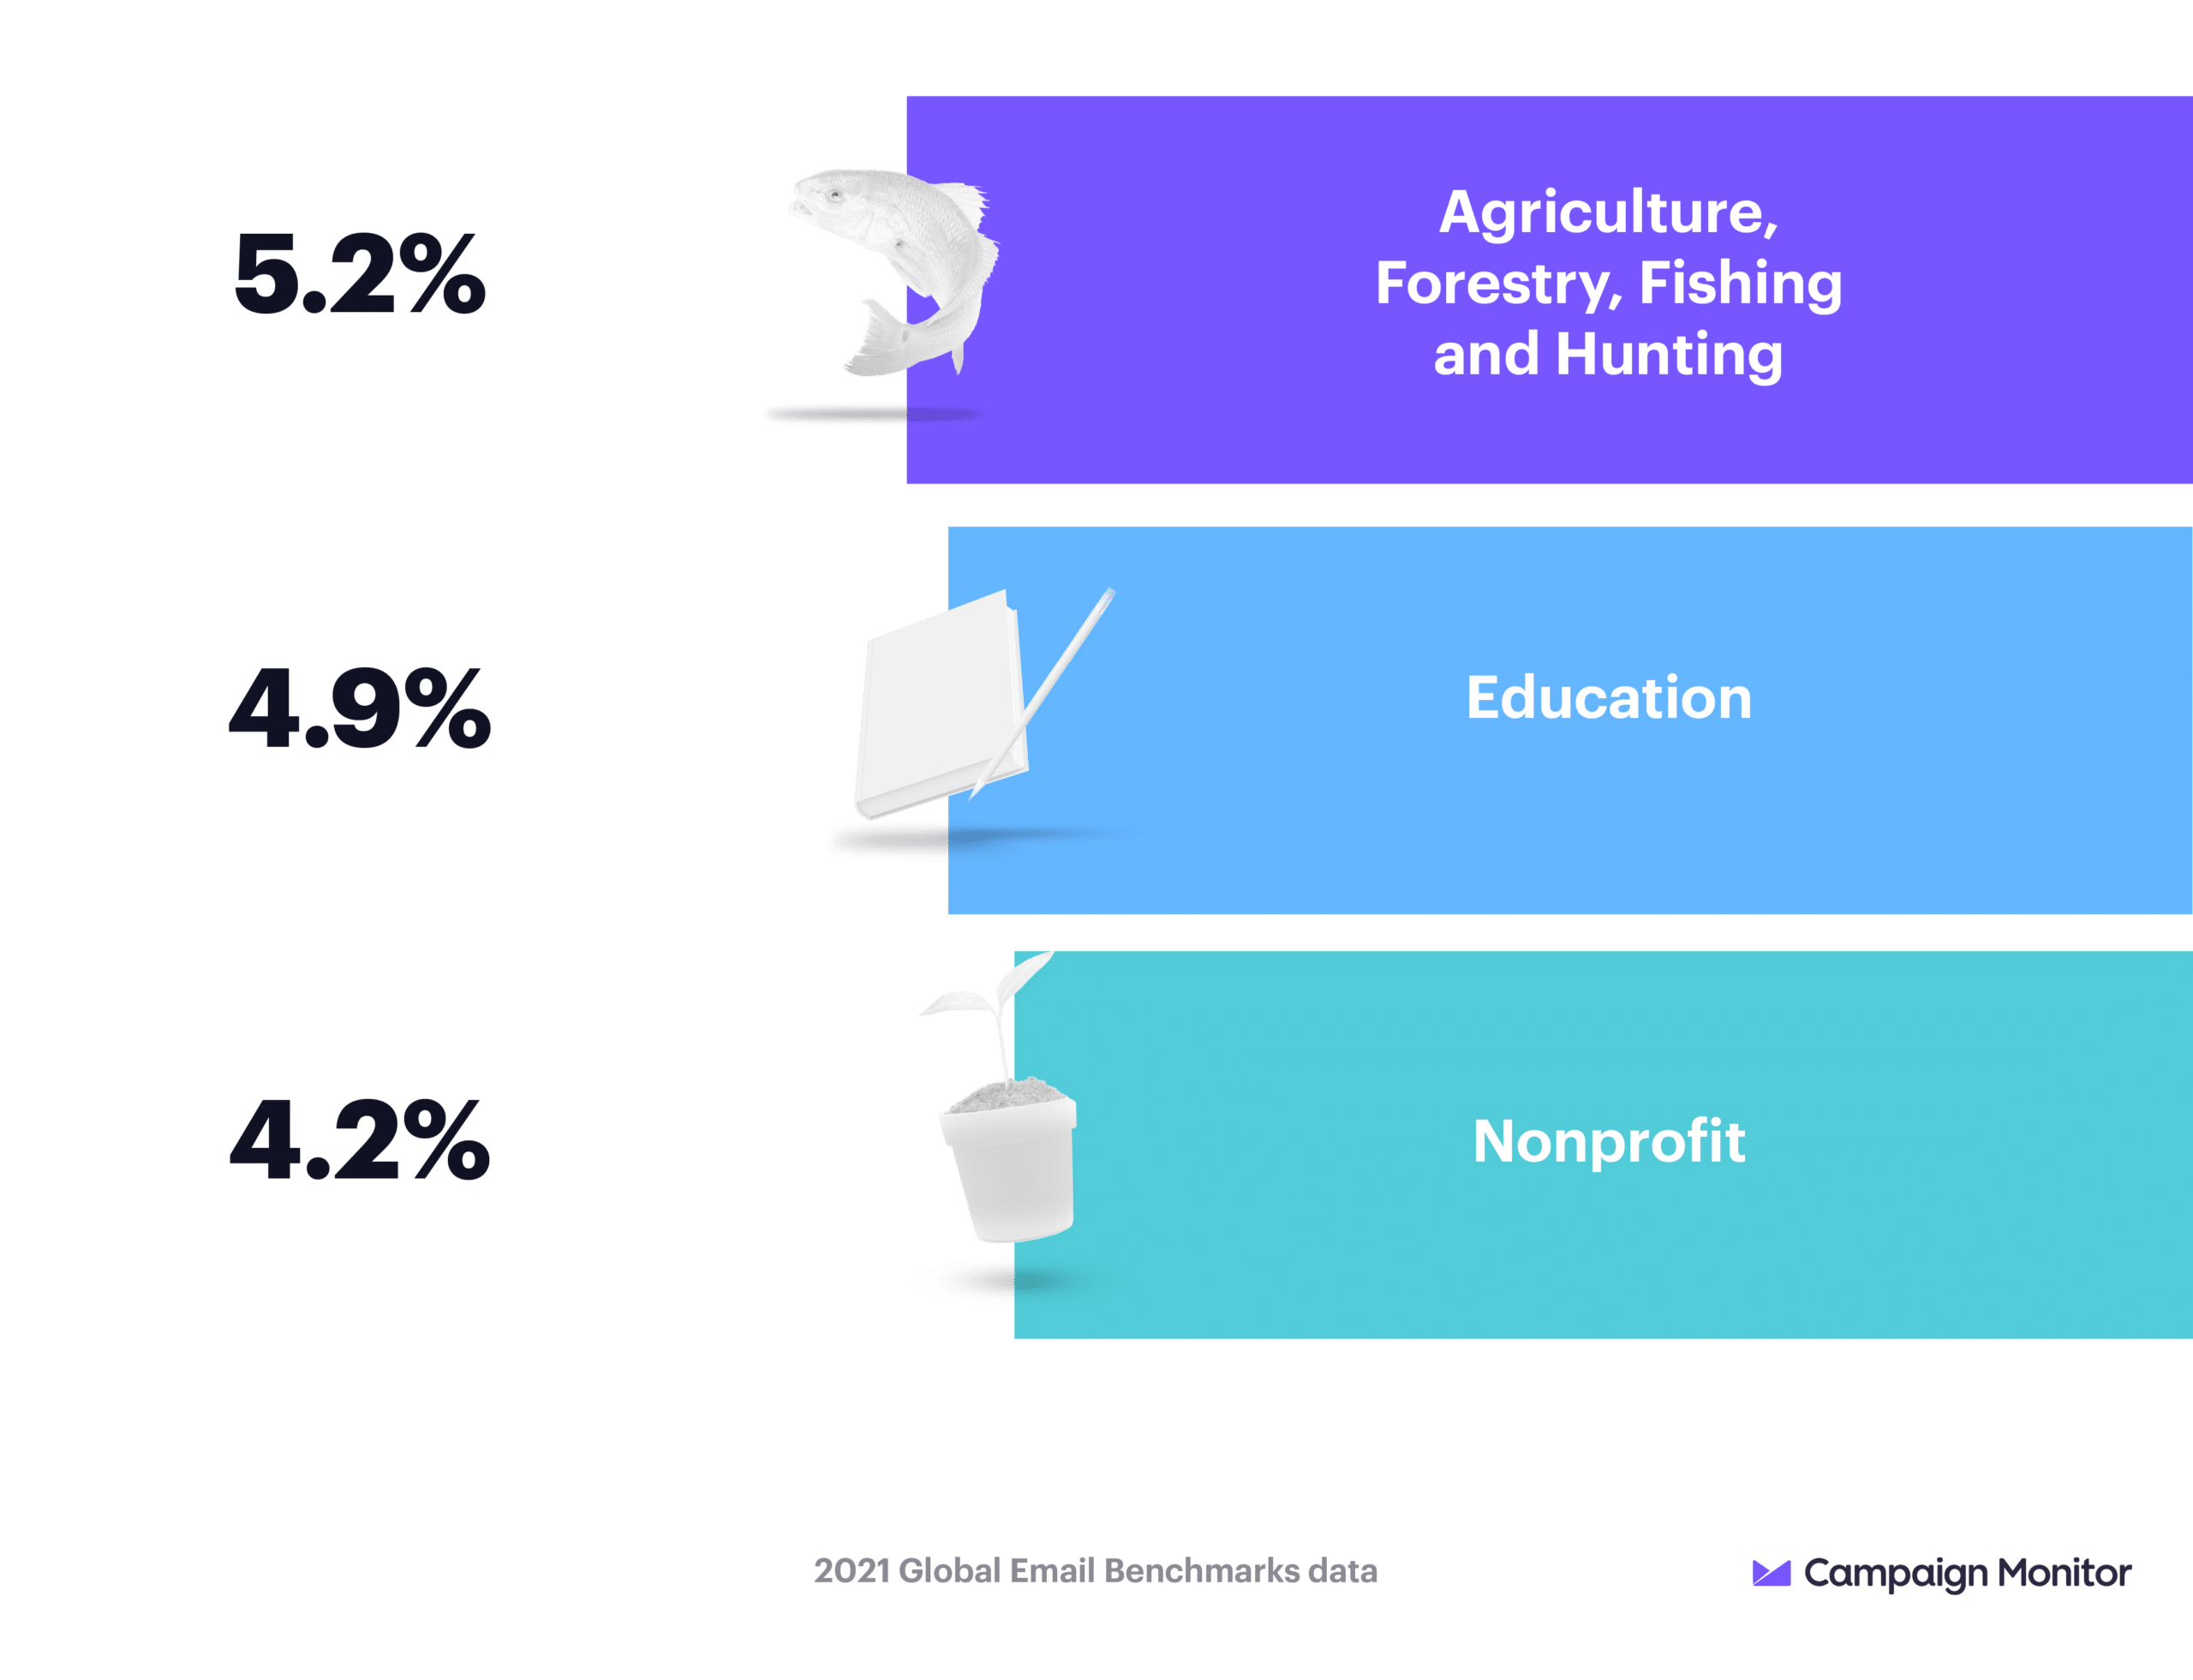
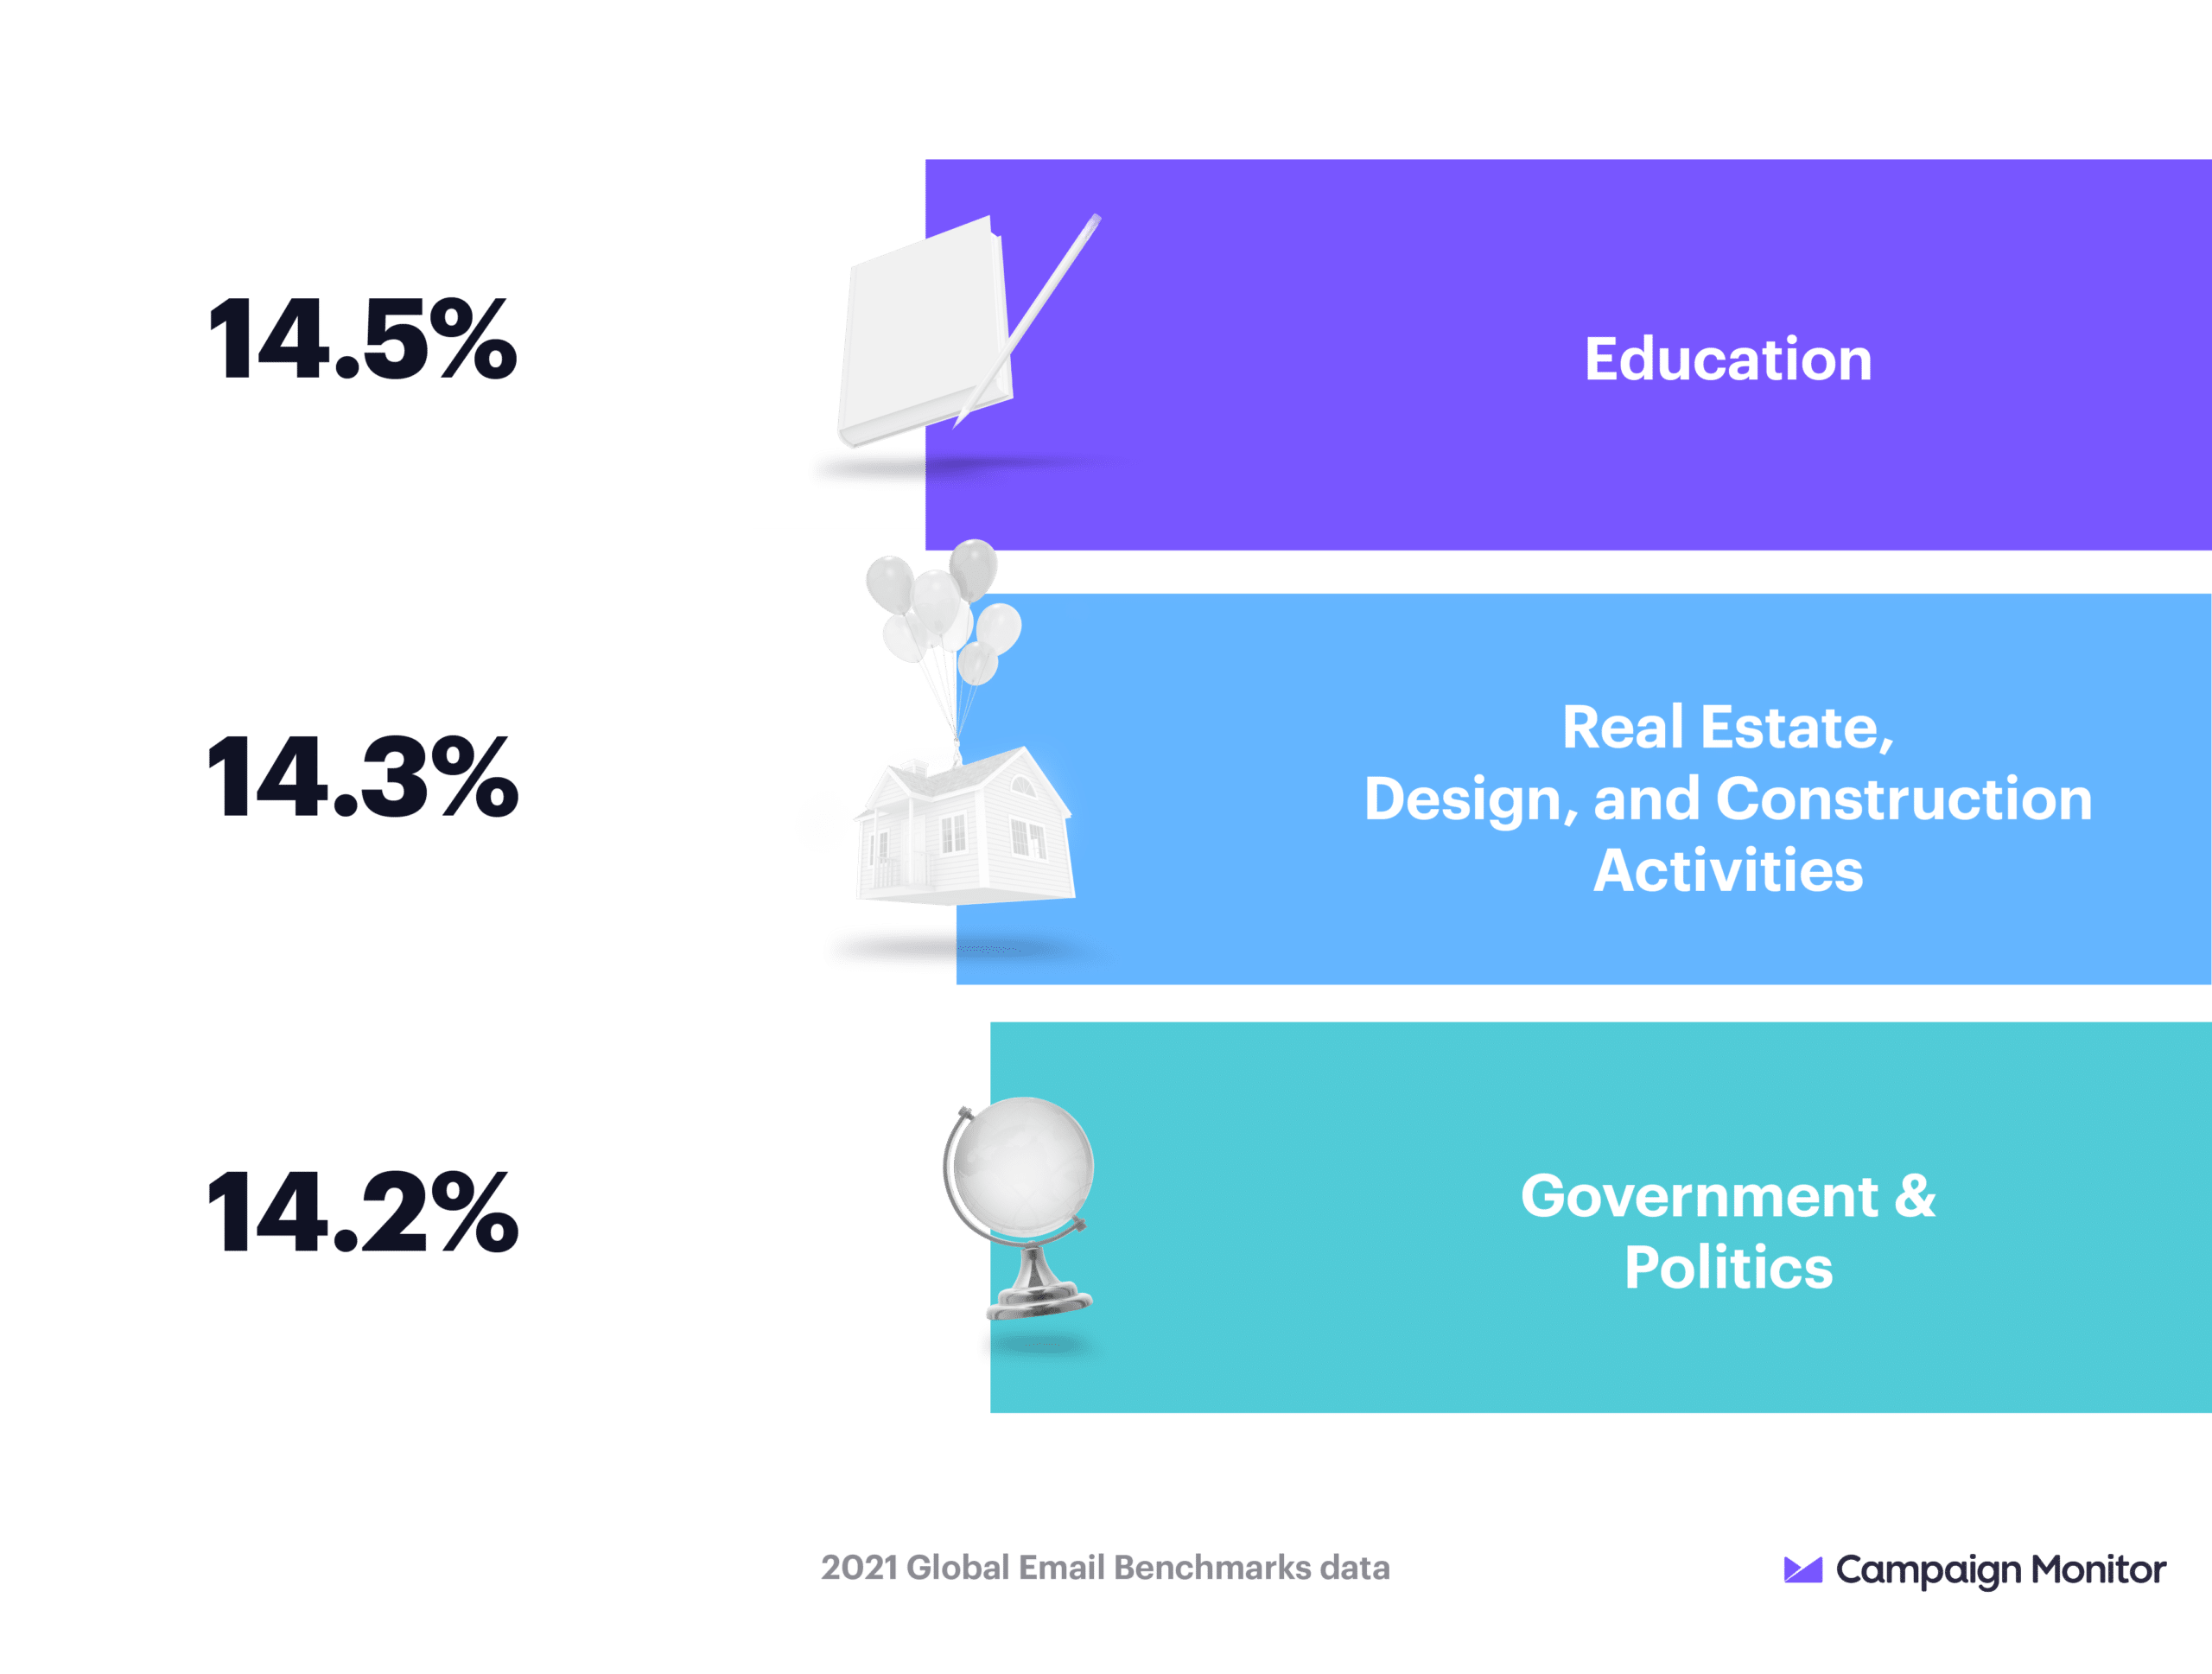
Emails from the education sector saw the greatest click-to-open rate out of all the industries, and performed in the top 3 for open rates and click-through rates as well. Subscribers are clearly invested in what educators have to say.
Many education emails contain vital information, especially during the chaotic year of 2020 when schools had to pivot many times over. Hopefully in the future, the year won’t require as many big changes. But even without the numerous shifts experienced in 2020, email will continue to be a pivotal channel for communication.
In the meantime, heightened engagement provides you with a chance to learn more about your audience. You have an opportunity to do more testing, gaining deeper insights about the content your audience engages with, when they like to engage, what sort of calls-to-action will inspire them to visit your website and more.
Some good news amongst the decreasing metrics! Unsubscribe rates dropped compared to the year before, meaning that even as subscribers weren’t clicking as often as they have in years past, they still want to be involved.
In a year packed full of newsworthy stories and “unprecedented” events, the UK engaged less with their email, whether they were newsletters or promotional offers. Subscribers’ decreased engagement shows they wanted to pause but not stop hearing from their favorite brands.
This is great news for marketers in the UK. As the world begins to adjust to the new state of things, subscribers will once again be ready to engage. Moving forward, you’ll want to make sure you are prepared for the uptick in engagement. Study your best-performing emails to understand why they were successful. Identify new segments so you can craft the most relevant and effective messages. Run re-engagement campaigns so your list is full of active subscribers.
It’s impossible to understand email metrics without considering the context surrounding them. Some industries experienced better engagement over the past year than others merely by the nature of their messaging. For instance, education emails contained vital information and subscribers often had to open and read them to know where to spend their days. Other industries, like retail, are easier to avoid.
That’s why you should look at your specific industry as well as the overall average to understand the health of your email strategy. In addition, you should look at how your email metrics are trending over time. Are your emails improving? Or is email performance sporadic?
In 2020, most individual industries experienced improved metrics compared to the previous year, despite email fatigue. Email remains one of the most powerful channels for connecting with your audience. Even when subscribers don’t click, they unsubscribed less often in 2020 than they did the year before, meaning email is positioned to see better engagement in 2021.
When you study your own metrics for the past year, consider the messages you sent: Are they necessary for your subscribers? Or are they only important to you? The emails you send should always put your subscribers and their needs first.
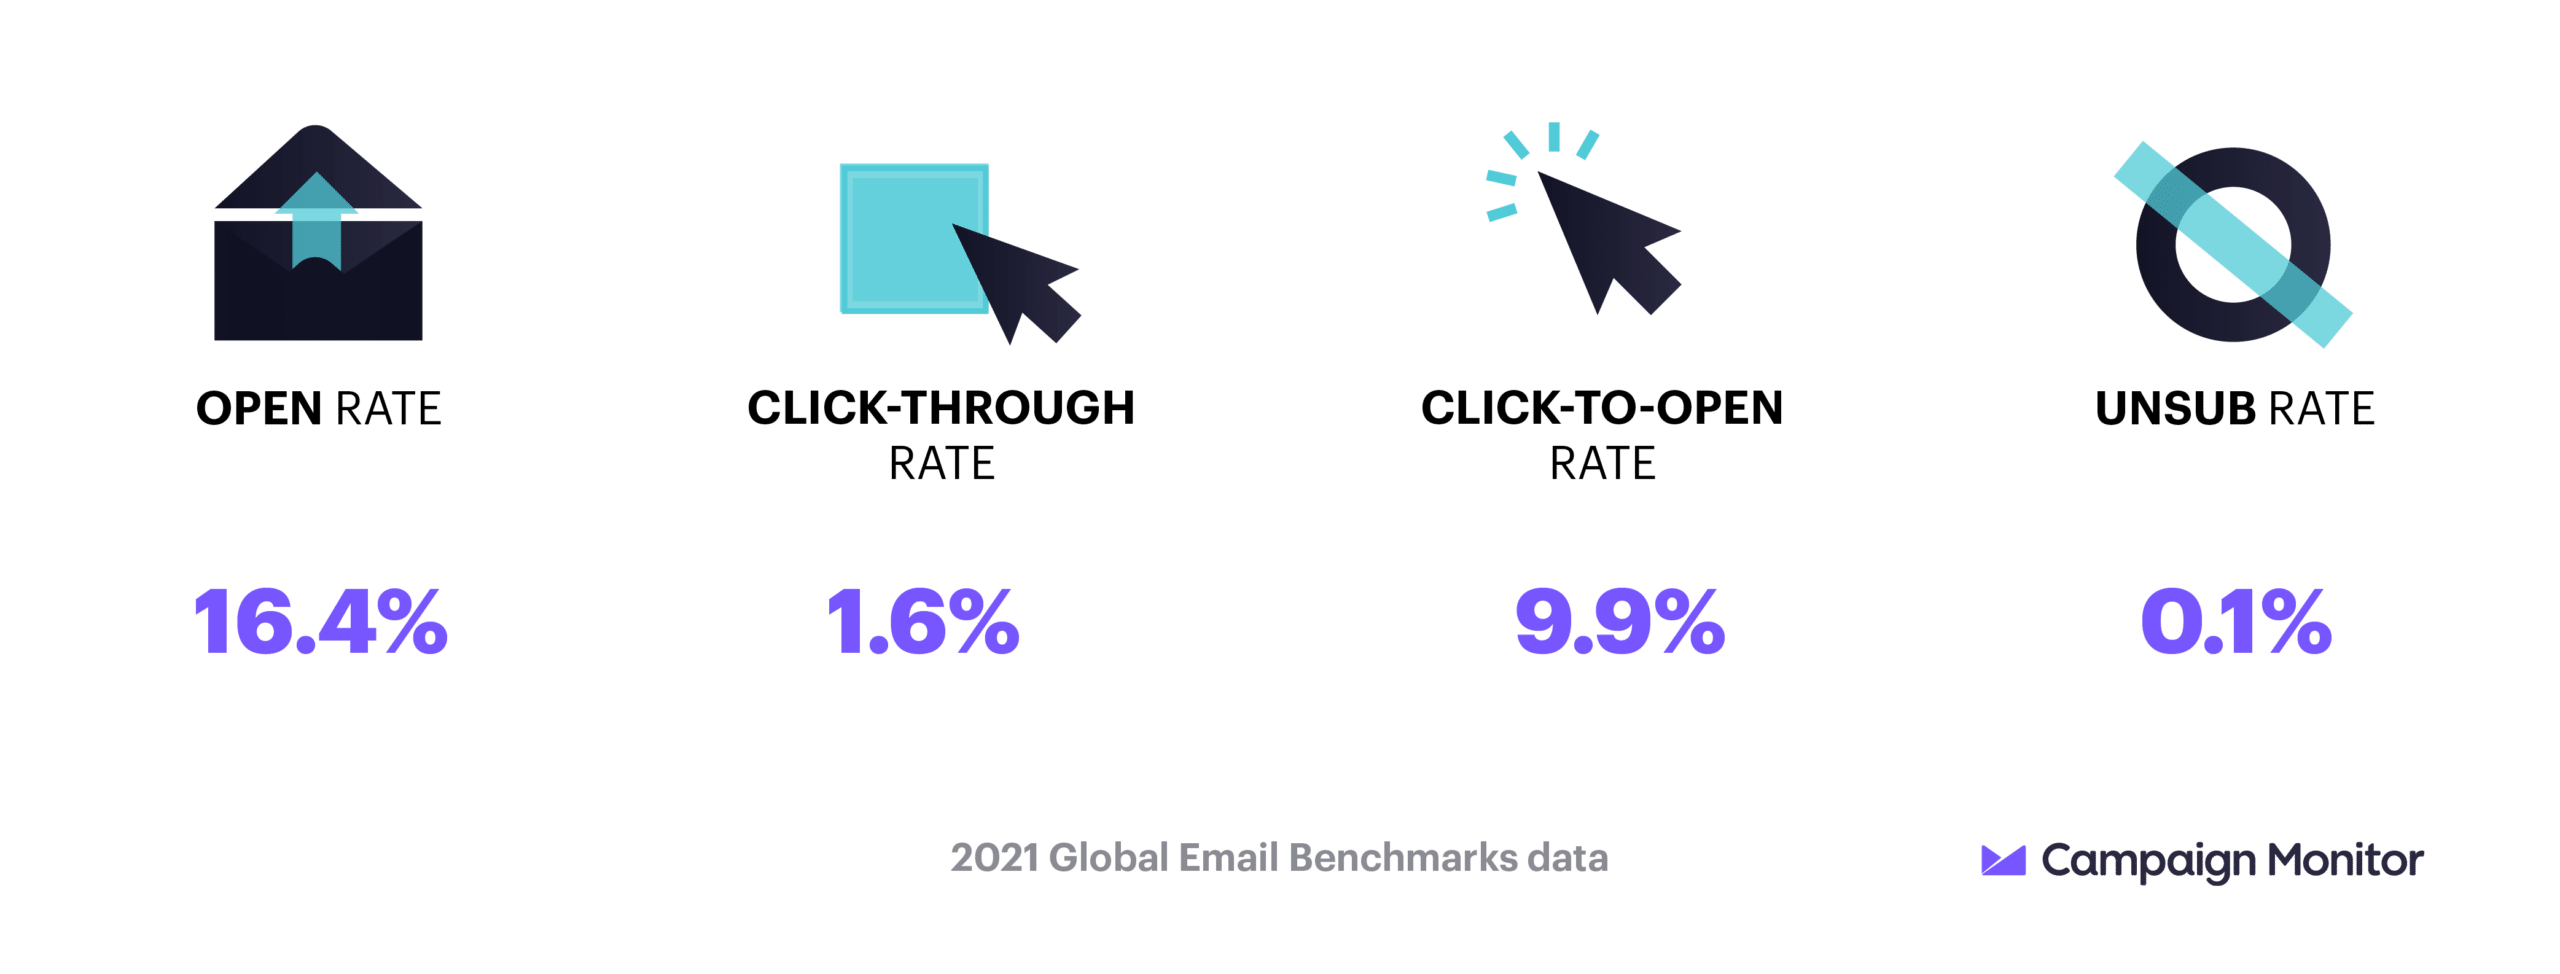
Here’s the breakdown for average metrics across all industries in the UK.
Explore more resources on open rates here.

Explore more resources on click-through rates here.
Explore more resources on click-to-open rates here.
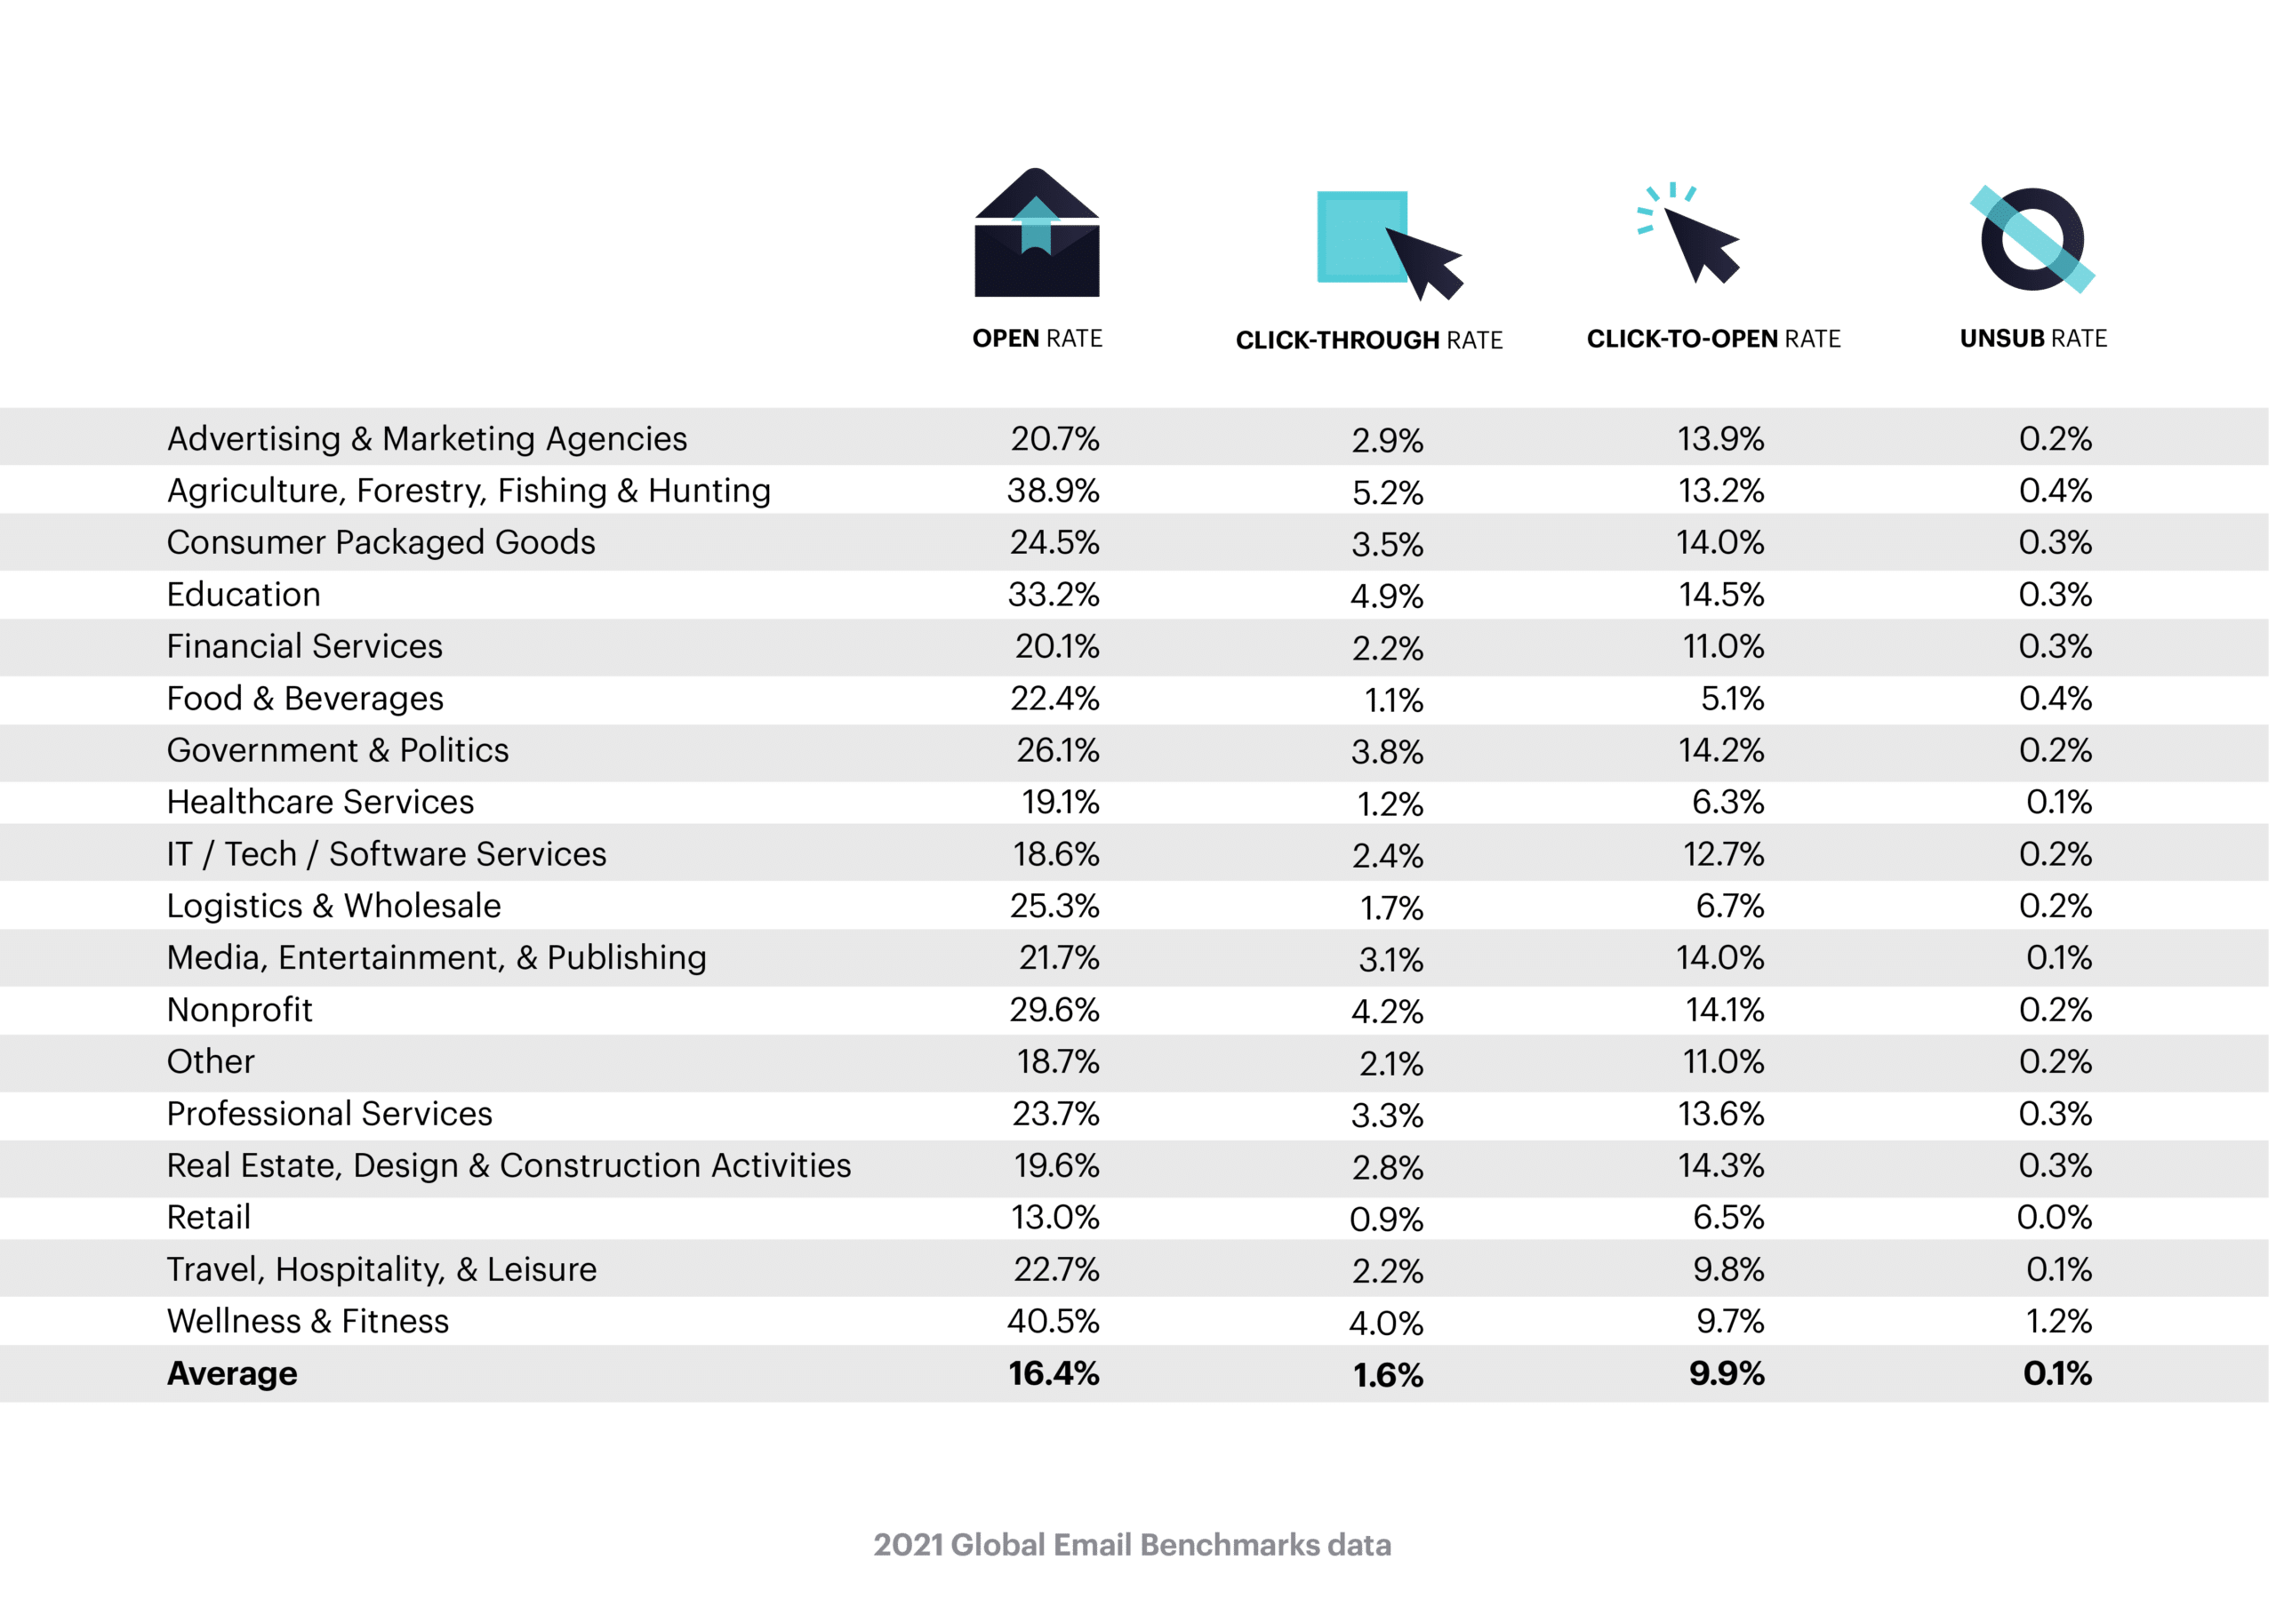
These are the average benchmarks broken down by metric so you can see how the UK compares to other regions.
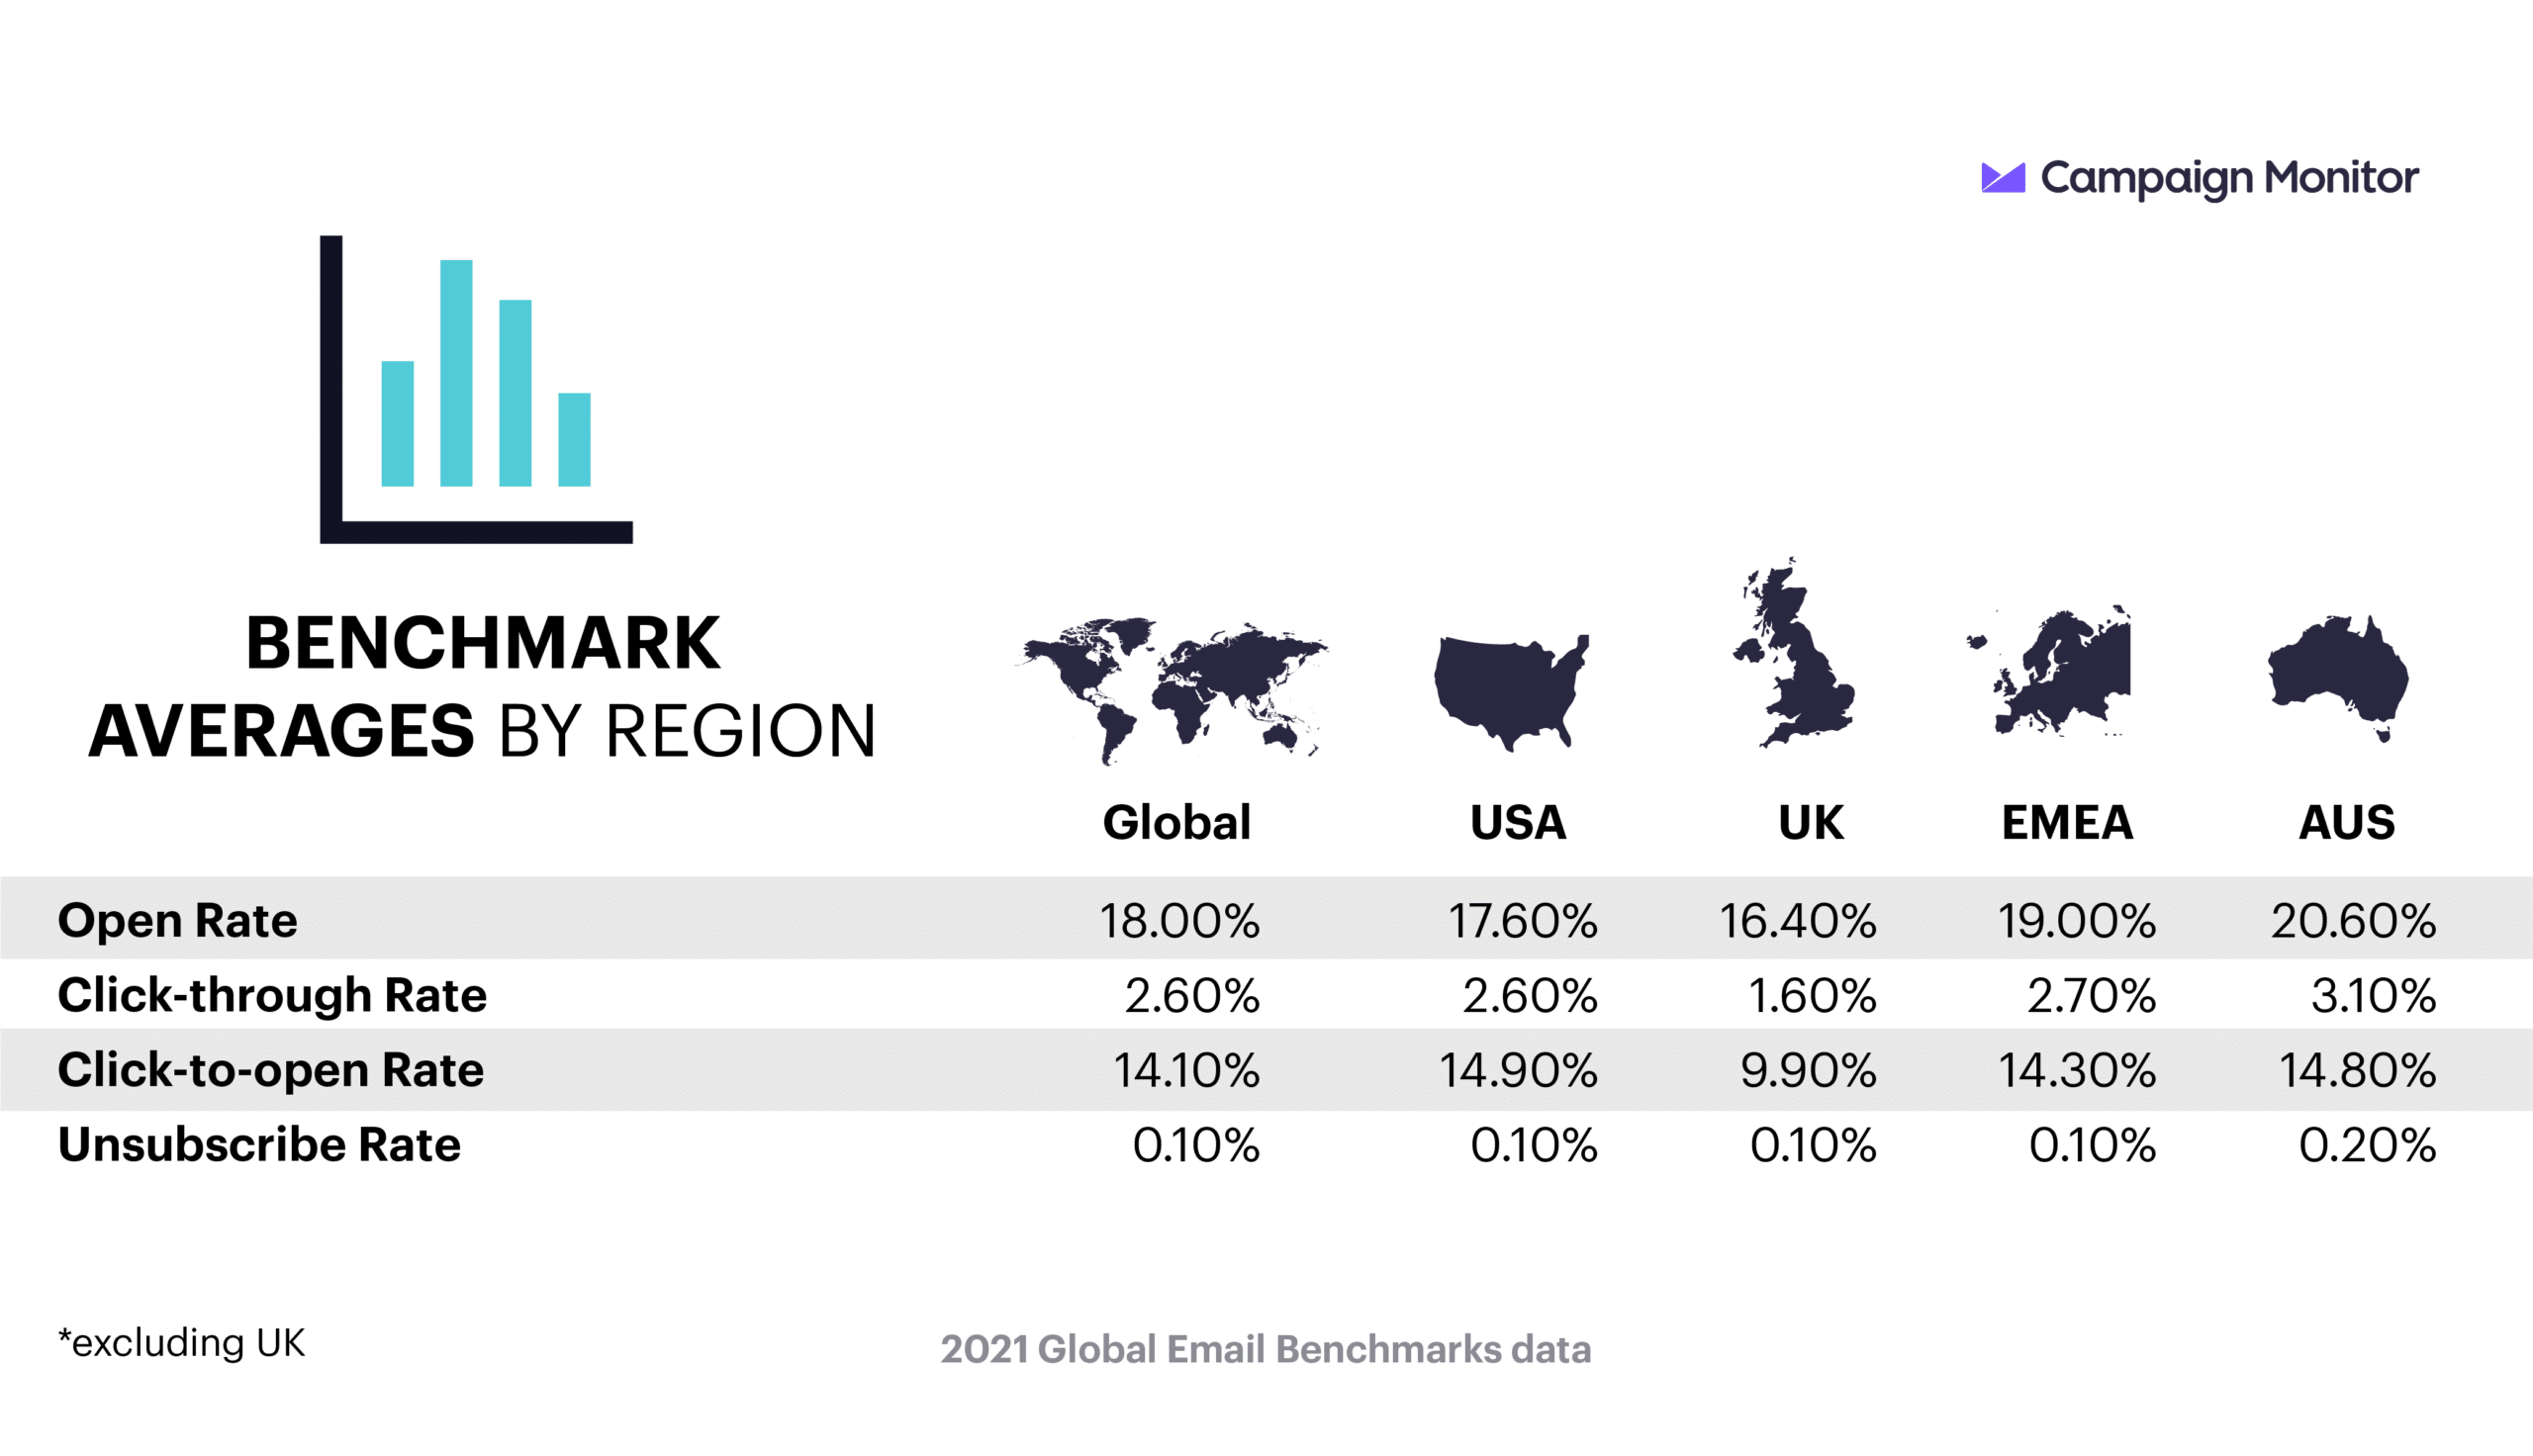
The number of email opens divided by the total emails that reached an inbox will give you your open rate.
While open rates vary from email to email, you can see an improvement in your open rates by varying the content included in the email and the subject line (and don’t forget the preheader text) you used. We found an average open rate of 16.4% in the UK.
Open rates way below average? Here’s how to improve your metrics:
Explore more resources on open rates >>
The number of subscribers who click on a link, button, or image in your email divided by the total number of emails that have been delivered will give you the click-through rate.
This metric can illuminate what type of content, images, and CTAs most resonate with your subscribers. When you know what content receives the greatest engagement, you can tailor your next email to deliver more of the content your audience prefers. We found a click-through rate of 1.6%.
How to improve your email click-through rate:
Explore more resources on click-through rates >>
While the click-to-open rate is similar to the click-through rate, they aren’t the same. The click-to-open rate finds the percentage of people who click through an email out of the number of opens, instead of the total number of emails delivered.
Click-to-open rates measure how effective the content of your email actually is, since this is the percent of people who click through after viewing your email. We found an average email click-to-open rate of 9.9%.
How to improve your email click-to-open rate:
Explore more resources on click-to-open rates >>
While it’s important to remember that some list churn is normal, healthy, and inevitable, keep striving for the smallest unsubscribe rate possible. An unsubscribe happens when someone who has been receiving your emails decides to opt out, asking to be removed from your email marketing list.
A higher-than-average unsubscribe rate can reveal that your audience no longer finds your content valuable enough to allow you into their inboxes and tell you it’s time to overhaul your email marketing strategy. We found an average unsubscribe rate of 0.1%.
If you need to overhaul your strategy, here’s how you can improve your email unsubscribe rate:
Explore more resources on unsubscribe rates >>
The term “bounce” refers to an email that could not be delivered, whether because of temporary delivery issues or permanent problems with the contact.
Whether the email experienced a hard or soft bounce, your bounce rate is the percentage of subscribers who did not receive your message in their inbox. Your bounce rate should stay below 0.2%.
If your bounce rate is above the average bounce rate, here’s what you can do to improve:
Explore more resources on bounce rates >>
Poor email deliverability can have disastrous results for your email marketing program. If your deliverability gets bad enough, you can even wind up on blacklists and not able to send email at all. Even if your deliverability issues aren’t that extreme, poor deliverability can still reduce your open rates and ultimately your conversions because your emails won’t land in your subscribers’ inboxes.
Poor engagement, being marked as spam, and bounces will all bring down your deliverability.
If you see poor engagement, here’s how to improve your email deliverability:
Explore more resources on deliverability >>
While these benchmarks can show you where and how your email marketing can be improved, you can also learn a lot by comparing your own email marketing metrics over the same period of time.
These benchmarks can show you the overall health of your email marketing strategy by letting you compare your metrics to your competitors. But you also need to compare your metrics today to your metrics over time to see the overall trends in your specific program.
After all, every audience is different. Not only is the UK audience different from an Australian audience—or the retail audience different from the government audience—but your niche’s audience will be different from your larger industry’s audience as well.
Only you know your audience. If you compare your results to these benchmarks, remember that your industry and specific niche mean you have a unique audience. Testing your content, offers, and strategy will refine your emails so that every send gets you one step closer to your best results possible.
Whenever you see us discussing “Averages,” we find these averages using all campaigns. Some industries send more emails than others, so we calculate averages by all campaigns sent, regardless of industry.
If you’re not sure what individual metrics entail or how they’re being measured, you can learn about email metrics at length in a guide.
To read up on what each metric means and how it’s calculated, visit this post.
As you’ll see, benchmarks can vary greatly between industries. And there’s no shortcut to seeing improved results from your marketing efforts. Testing and measuring your email results will help you determine how well your email marketing performs. and identify the areas where you can see the most improvement for your efforts.
We hope having this information demystifies email marketing metrics and how you should set—and exceed!—email marketing goals that make sense for your specific brand in your specific industry.

Join 250,000 in-the-know marketers and get the latest marketing tips, tactics, and news right in your inbox.
SubscribeWith our powerful yet easy-to-use tools, it's never been easier to make an impact with email marketing.
Try it for free