Straight to your inbox
Get the best email and digital marketing content delivered.
Join 250,000 in-the-know marketers and get the latest marketing tips, tactics, and news right in your inbox.
SubscribeWe analyzed billions of emails sent in the United States between January and December 2020.
These campaigns were sent to subscribers around the world from United States businesses and nonprofits using Campaign Monitor.
We’ve compiled all that data into a single, comprehensive resource so anyone doing email marketing in or for the US can study industry averages and measure how their email marketing strategy compares.
Despite the global COVID-19 pandemic, most email marketing benchmarks remained steady in 2020 and several benchmarks have even increased. Keep reading to find out how your brand compares to other US-based organizations and whether you beat the benchmark for your industry.
Email marketing continues to be a key way that marketers interact with audiences. The data bears this out, with modest increases in benchmarks across most industries and only a few minimal decreases.
Some of the most notable findings (and what they mean for marketers):
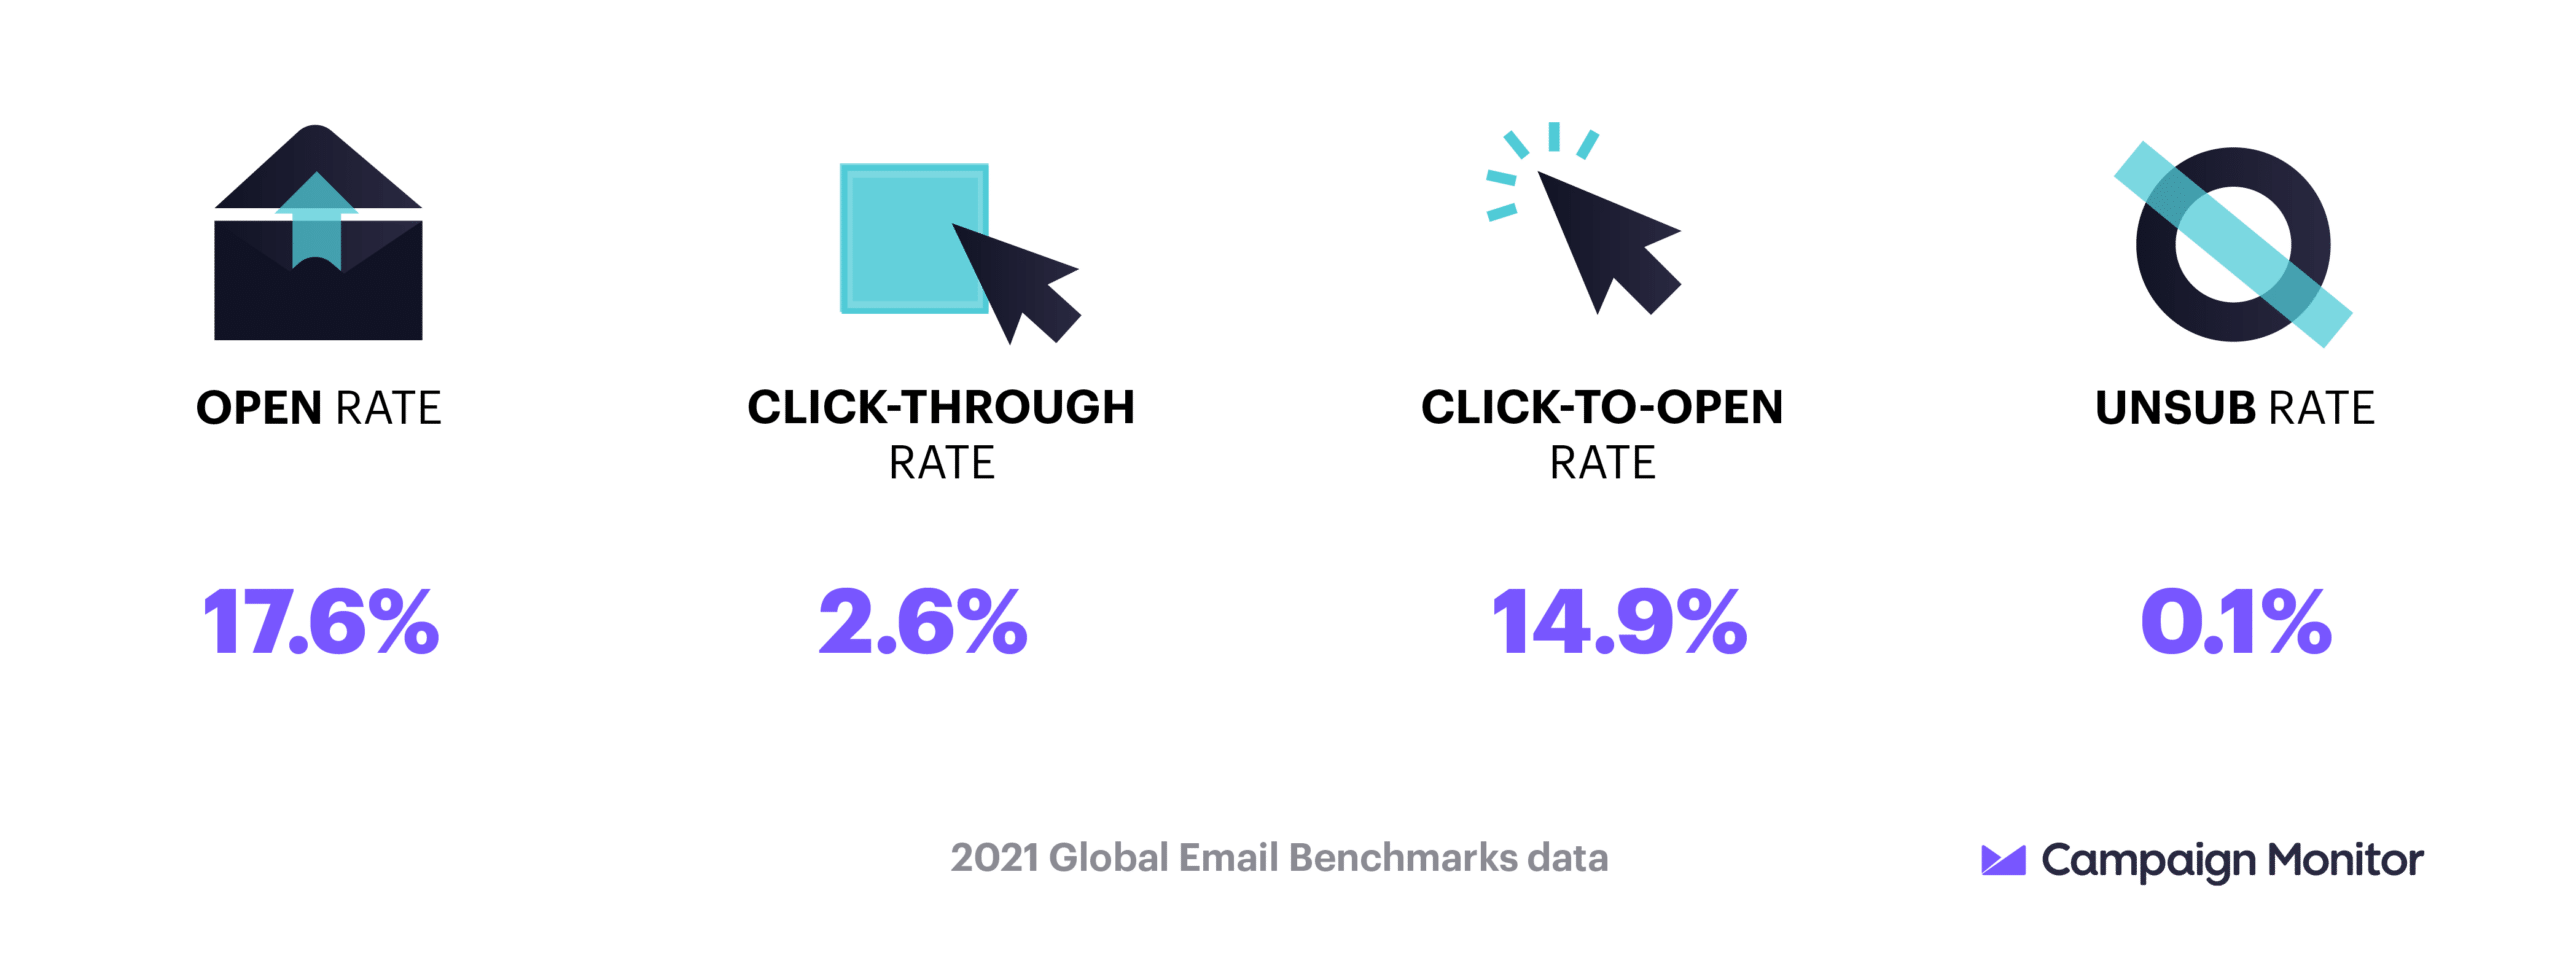
The average open rate, click-through rate, click-to-open rate, and unsubscribe rate across all industries remained relatively steady. Some industries and benchmarks showed a modest increase.
Because metrics increased across the board, including the unsubscribe rate, we can conclude that email marketing has reached more people this year, while engagement and satisfaction remains the same.
Amid a year when travel, leisure, and hospitality was almost completely shut down due to social distancing guidelines, email metrics reveal that subscribers are still interested in marketing from these industries.
Open rates, click-through rates, and click-to-open rates all increased slightly, while unsubscribe rates hover near the same levels.
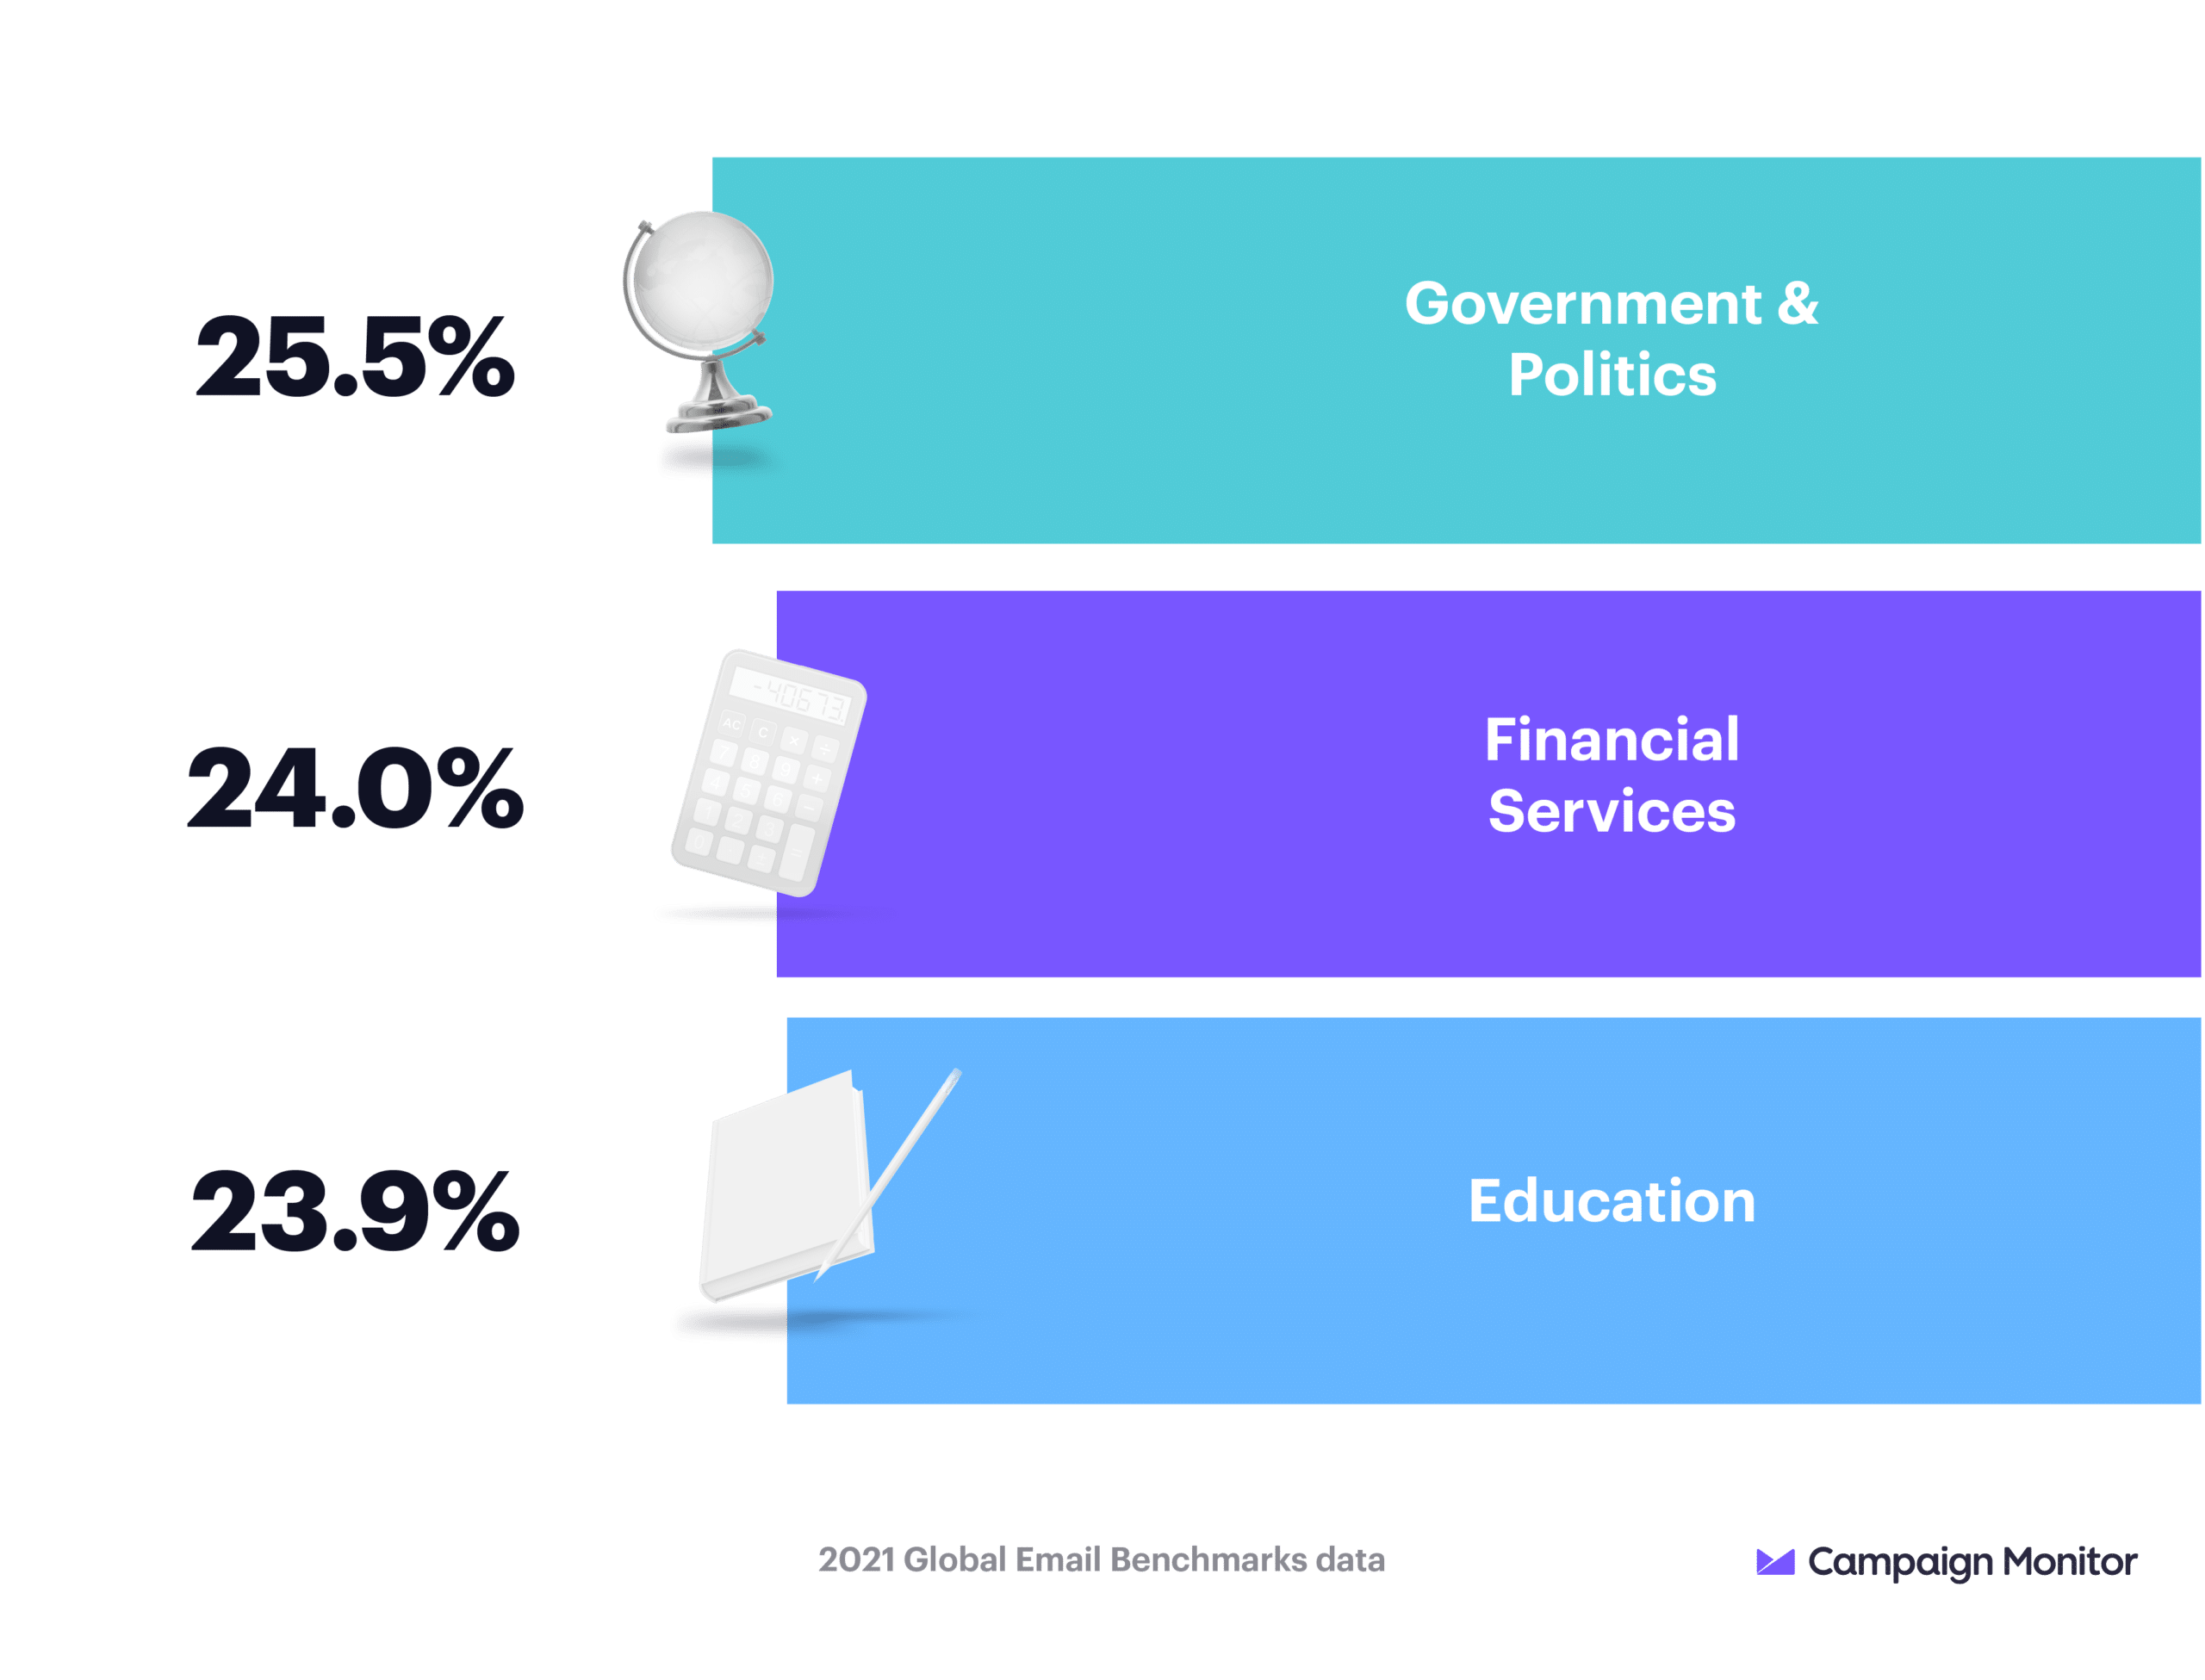
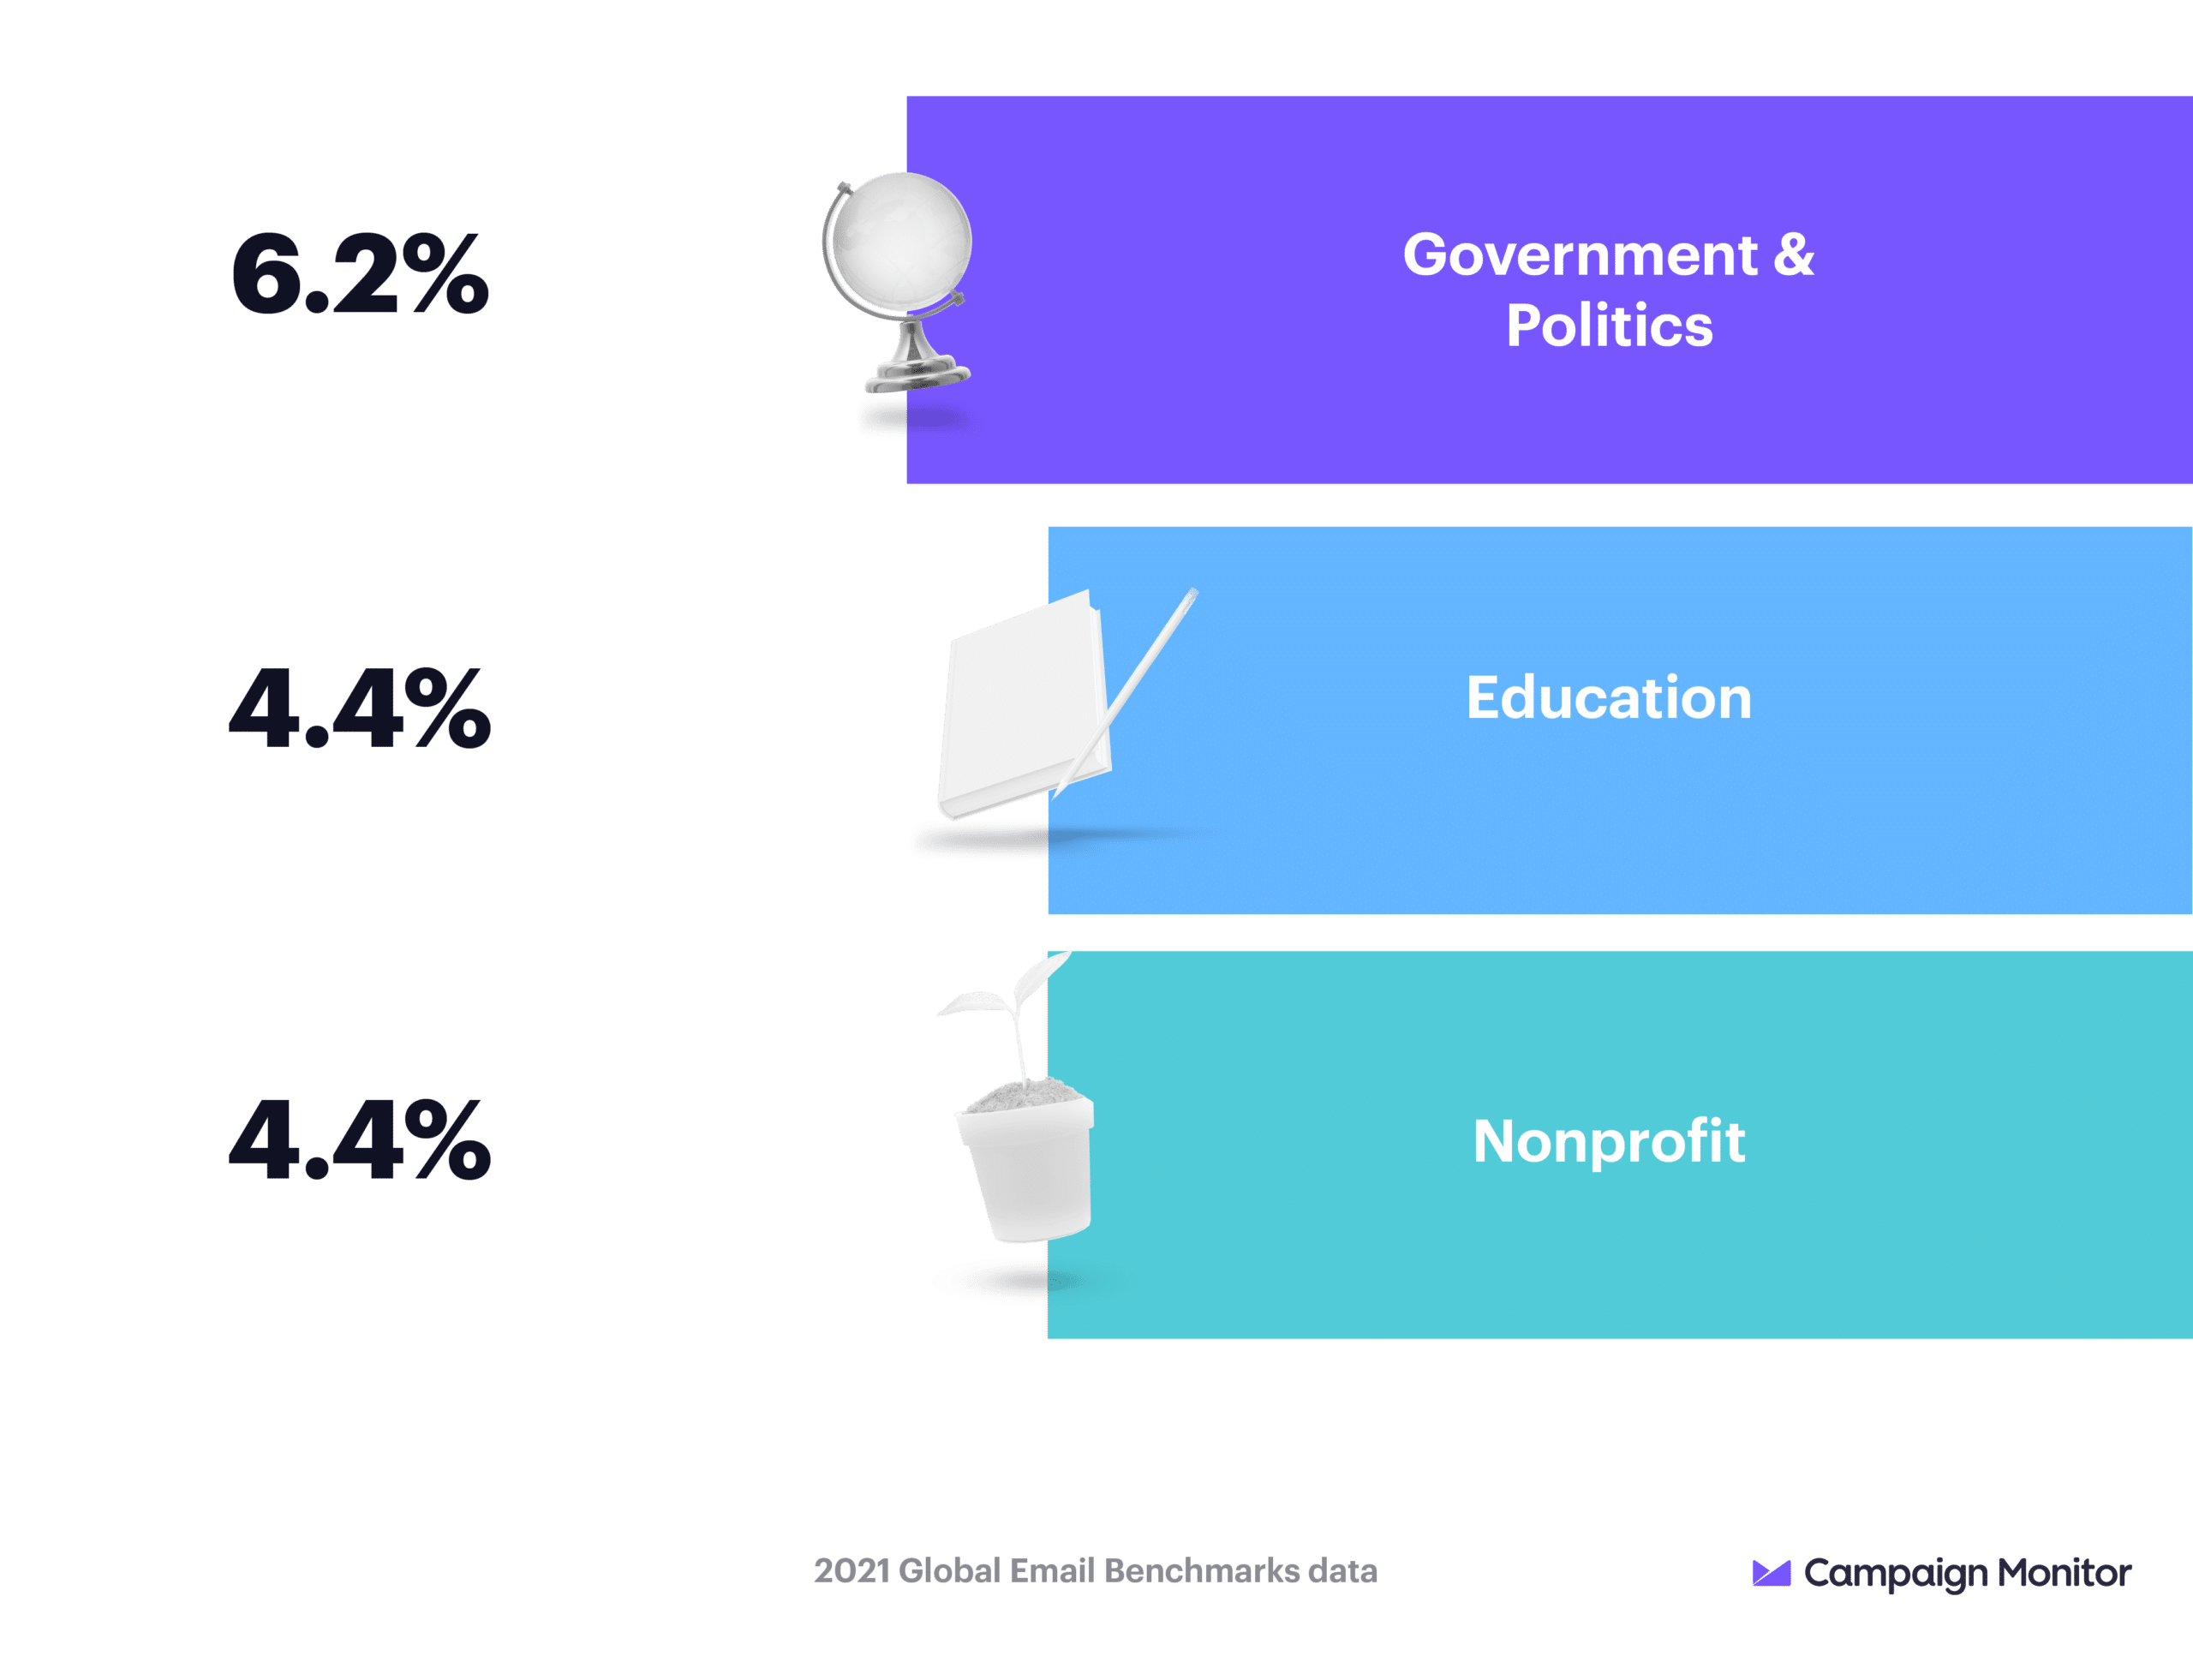
The click-to-open rate for government and political emails jumped 10% — the biggest gain from 2019 to 2020 across industries and metrics. Additionally, open rates and click-through rates increased 2-3% from last year.
Government and political emails have been at the top of performance since last year, but this year, healthcare out-performed 2019’s other highest performer: Media and entertainment.
The exact reason for this is unclear, but given the health crisis of 2020, it’s not surprising to find healthcare emails at the top of the list.
More people opened financial services emails in 2020, but the number of people who clicked through decreased significantly. This suggests that while people are interested in financial services emails, current strategies for converting that interest into clicks are not working. There is an opportunity for marketers in this industry to try something new.
Though a fewer percentage of people opened education emails, more of those who did clicked through. This suggests a high level of engagement from some subscribers.
The biggest reason the retail industry underperformed in 2020 is the dramatic decrease in click-to-open rates: Down nearly 7% from 2019.
This large decrease suggests an overall dip in engagement, even as open rates and click-through rates remain relatively steady.
Here are the average benchmarks for US senders at a high level.
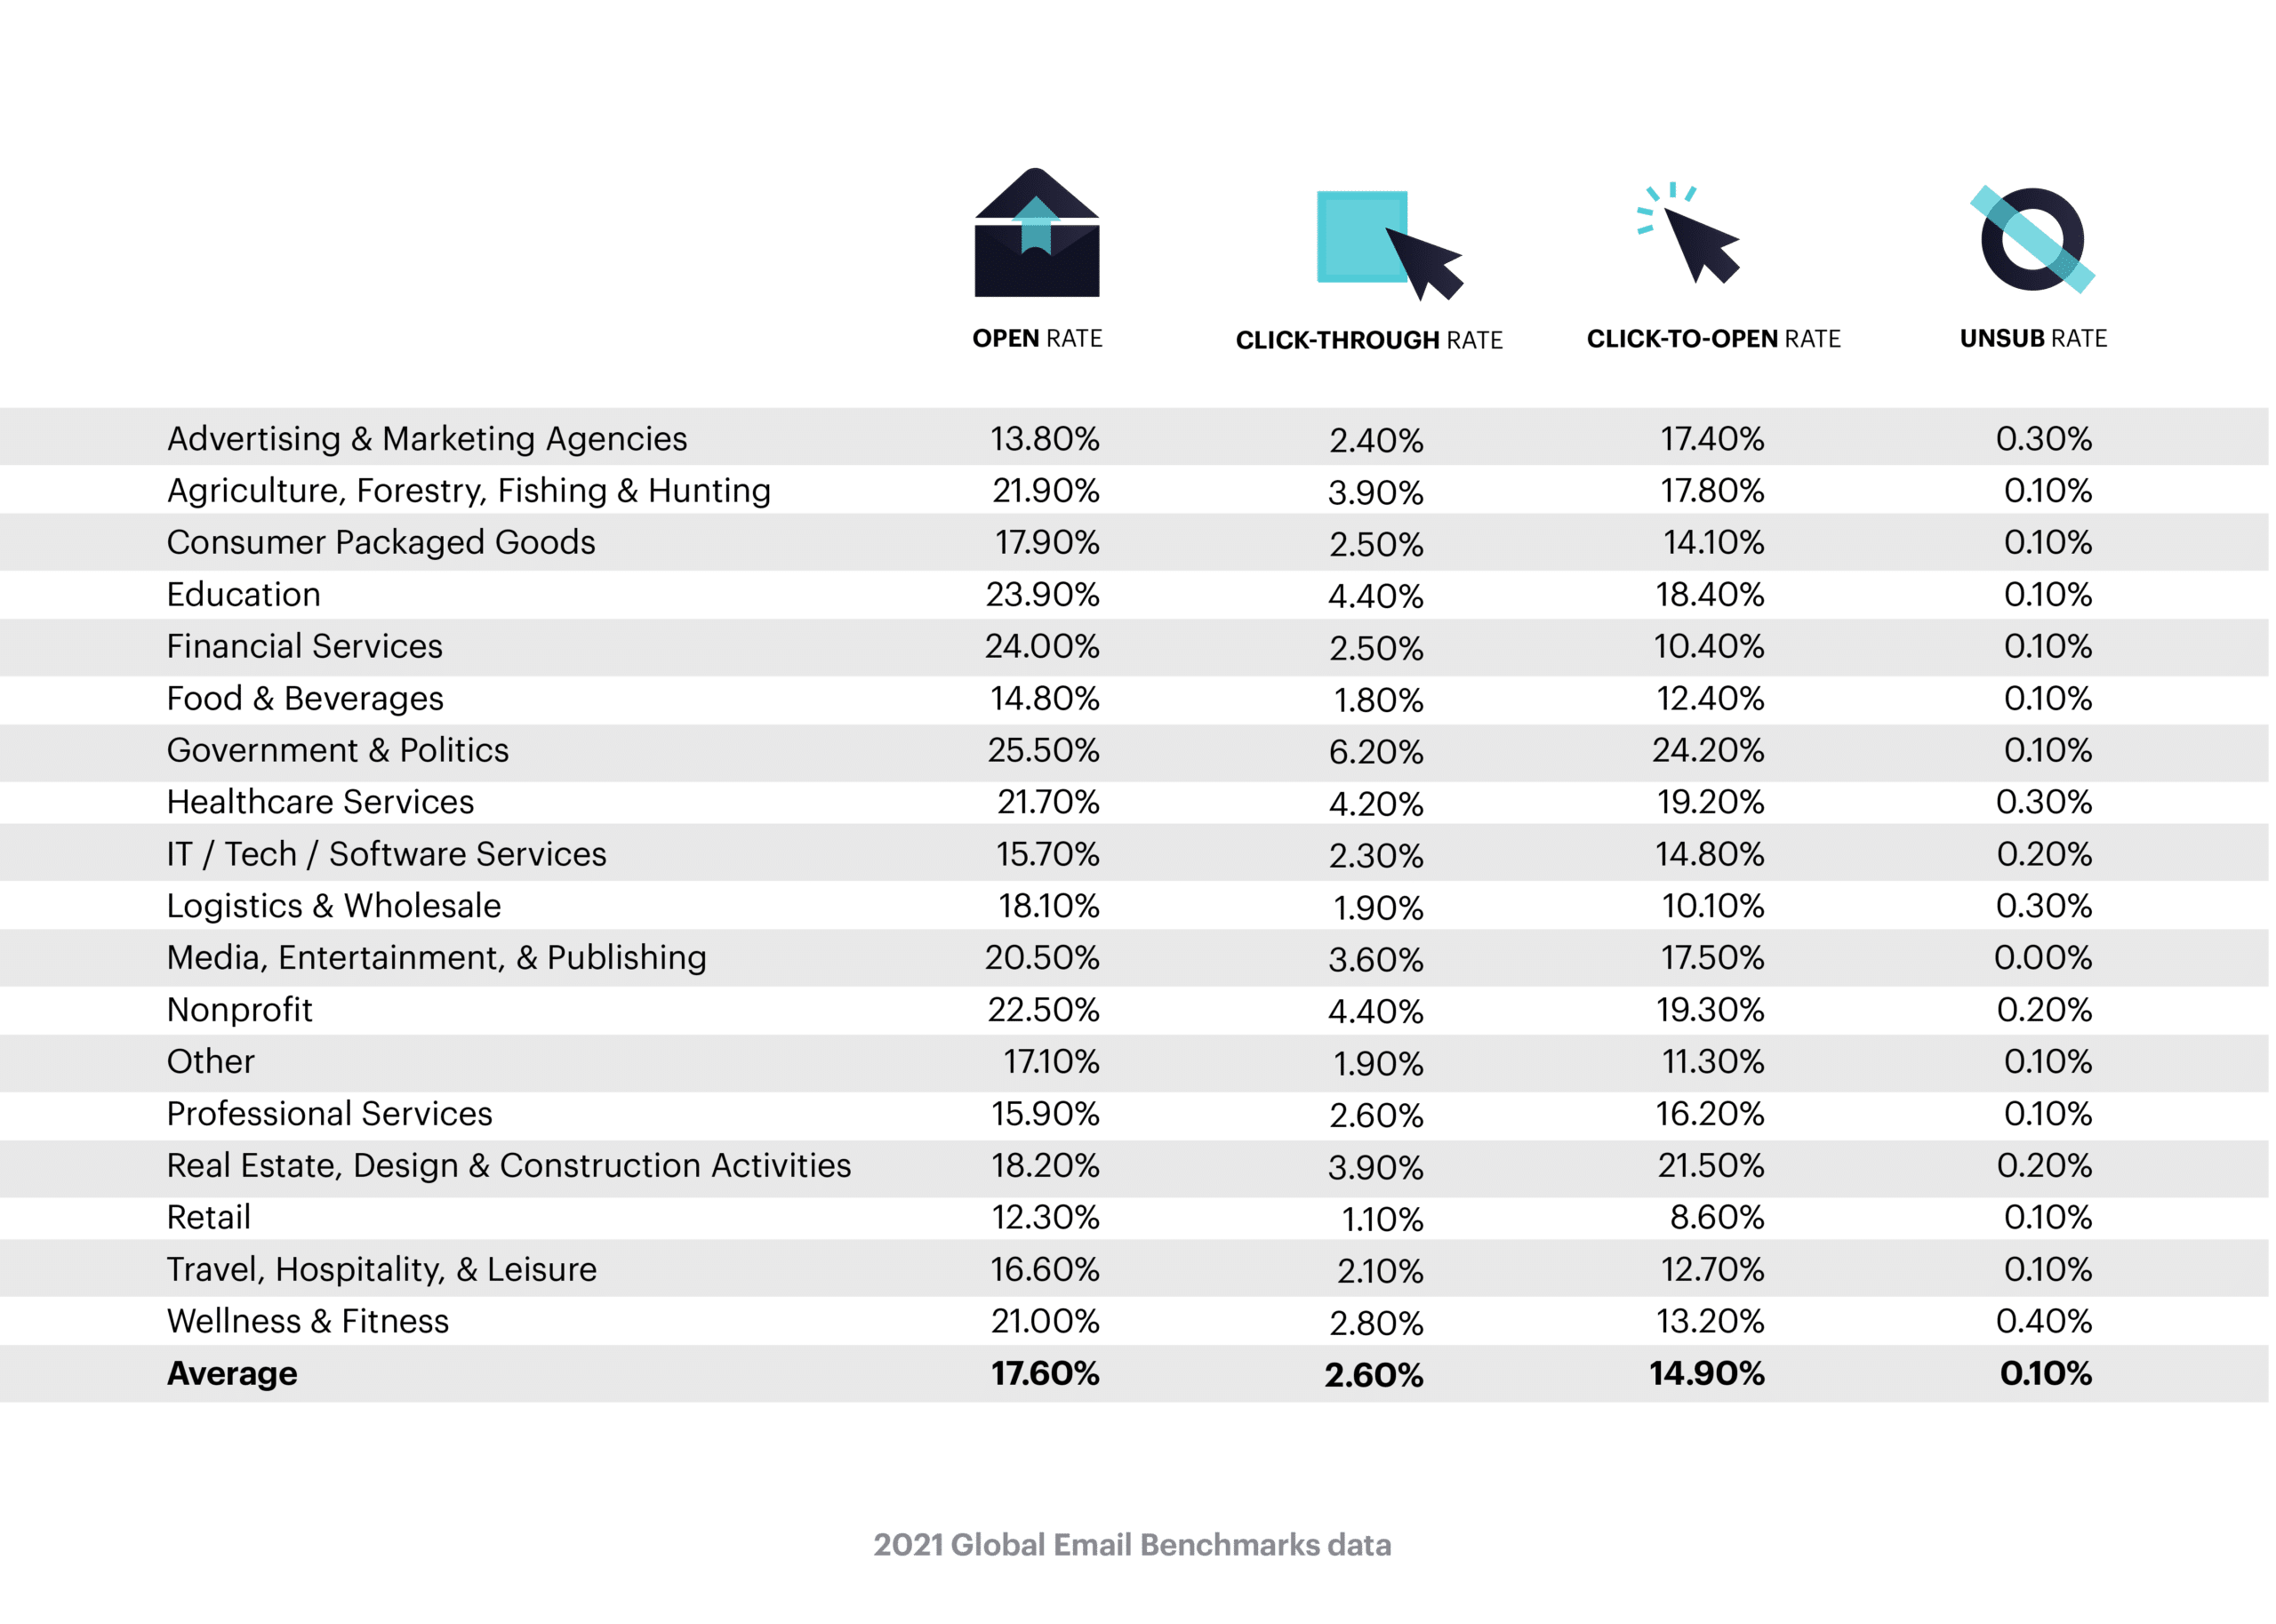
Check out the data below to discover how your key metrics perform relative to other US companies in your industry.
Explore more resources on open rates.
Explore more resources on click-through rates.
Explore more resources on click-to-open rates.

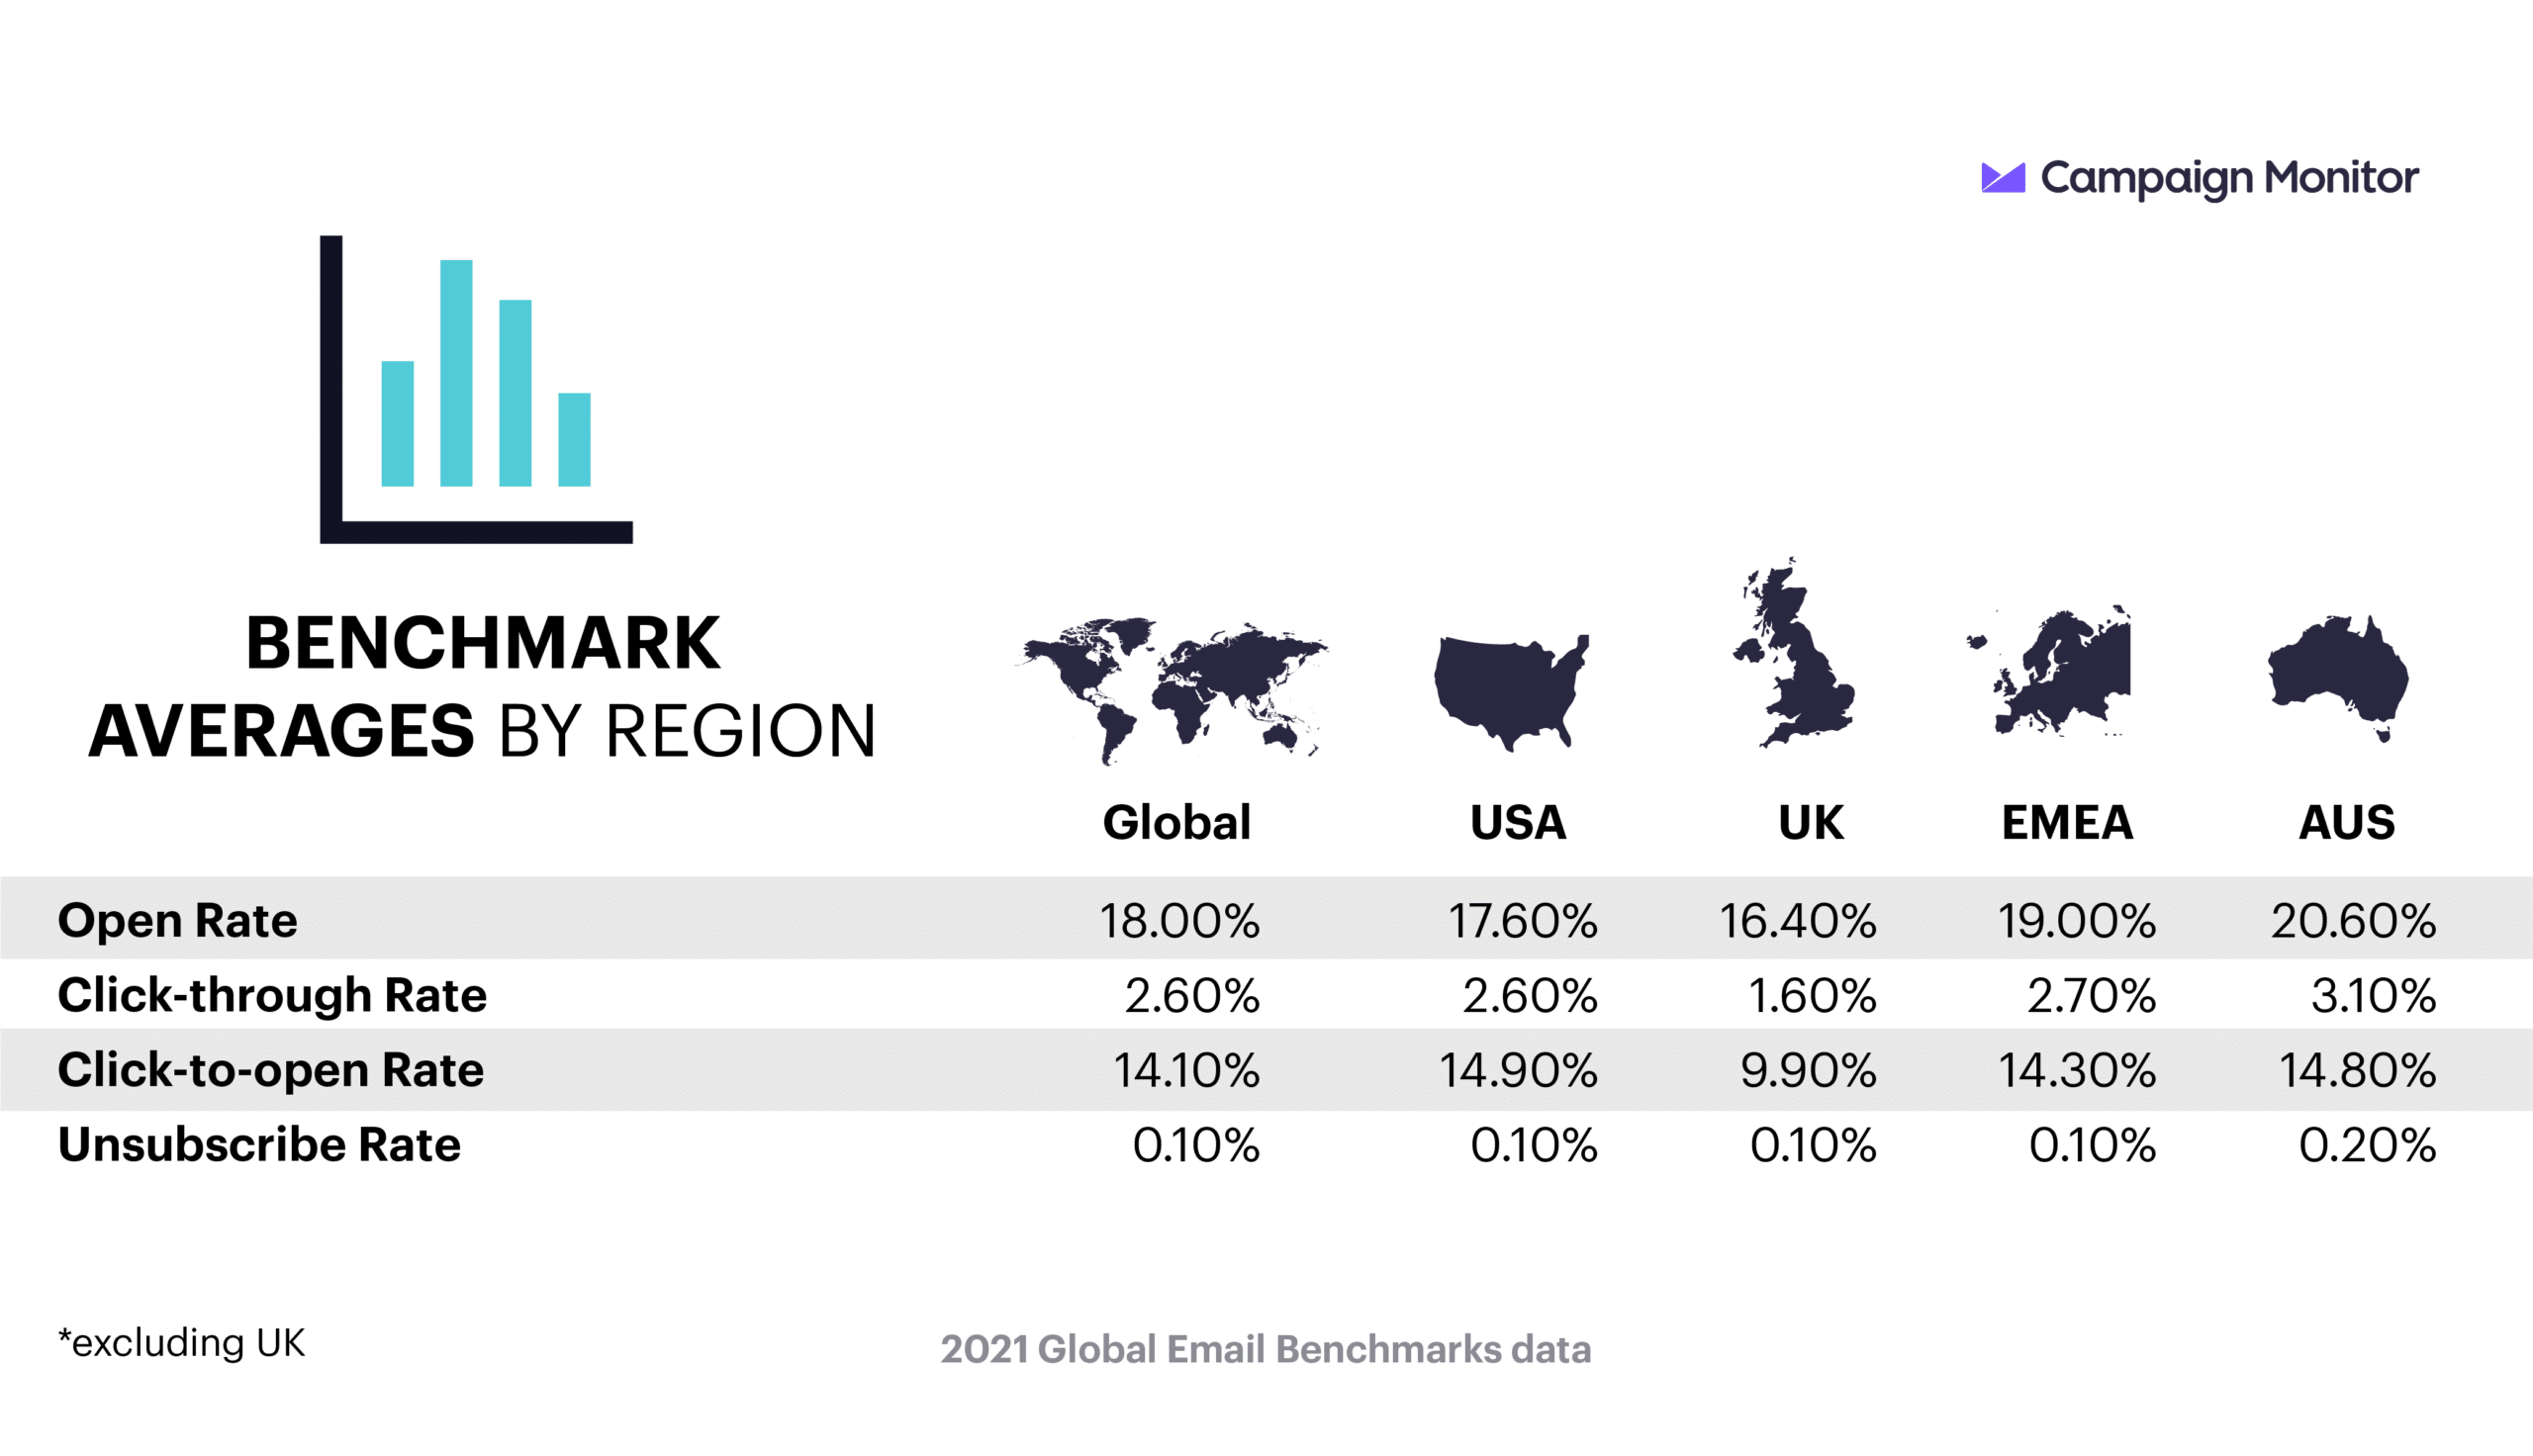
These are the average benchmarks broken down by metric so you can see how the US compares to other regions.
Check out some of our resources to improve your metrics:
While these benchmarks can show you where and how your email marketing can be improved, you can also learn a lot by comparing your email marketing metrics over time.
Are your open rates staying consistent and even improving while you grow your list? Or is an old and stagnant list resulting in low open rates? It’s also important to keep your eye on open rates, spam rates, and your deliverability to ensure you grow your list wisely, rather than just quickly.
These benchmarks can show you the overall health of your email marketing strategy by letting you compare your metrics to your competitors. But you also need to compare your metrics today to your metrics over time to see the overall trends in your program.
Only you know your audience. If you compare your results to these benchmarks, remember that your industry and specific niche means you have a unique audience. Testing your content, offers, and strategy will refine your emails so that every send gets you one step closer to your best results possible.
You’ll notice we discuss “averages.” These averages are created using all campaigns. Some industries send more emails than others, so we calculate averages by all campaigns sent, regardless of industry.
We also discuss email metrics at length in this guide. To read up on what each metric means and how it’s calculated, visit this post.

Join 250,000 in-the-know marketers and get the latest marketing tips, tactics, and news right in your inbox.
SubscribeWith our powerful yet easy-to-use tools, it's never been easier to make an impact with email marketing.
Try it for free